How to run the bullet workflow
Review
In a previous tutorial Submit job to remote server we described how to build a vistrails workflow to run a Mathematica job remotely. Here is a brief summary:
Note
vistrails modules are highlighted as module
Prepare the Mathematica script to accept arguements from command line and export figures to PNG files. It should run like this:
/path/to/MathKernel -script scriptname.m <arguments>
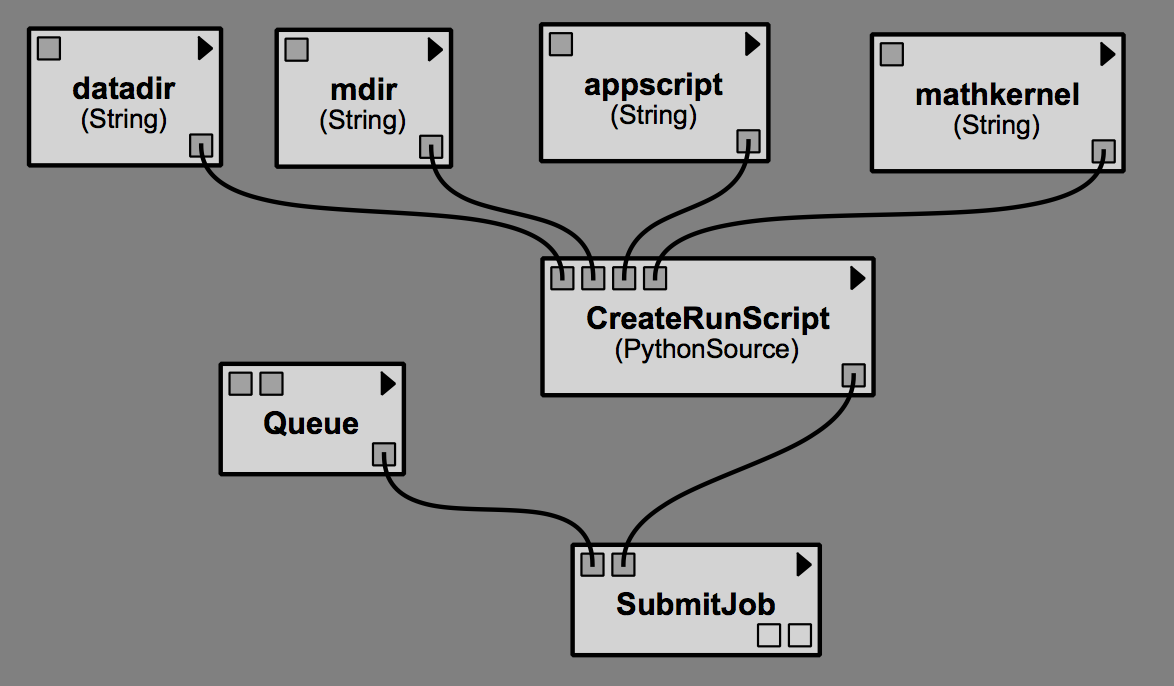
Construct a simple VisTrails workflow to run this Mathematica script. The modules include:
Multiple
Stringmodules: as user-input parametersA
PythonSourcemodule: connect to parameters and assemble a bash script (e.g. a “run-script” file) to run the Mathematica script, make sure all path set correctly, so you can just run this command on remote host:$ ./run-script
A
SubmitJobmodule: connect toPythonSourcemodule, get the runscript and copy to the serverA
Queuemodule: specify your remote hostOptional
DownloadFile,DownloadDirectorymodules: to download data from server to localOptional
ImageViewerCellmodules: to show downloaded images in spreadsheet
The Bullet VisTrail Workflows
Overview
This workflow serves as a simple example of using VisTrails software to manage Tomography data processing workflow.
A complete tomography experiment usually produce many datasets (collected using different settings, or from different instrument) with large size (several GitBytes). The data processing workflow includes raw data checking, data reconstruction, and a wide range of data analysis tasks(visualization, segmentation, skeletonization, surface generation, measurement, histogram, etc.). The data processing code are developed by community using Mathematica, Matlab, Fortran, C/C++, Python, etc. We also want to run data processing jobs in parallel submitted to HPC resource.
We choose to use VisTrails workflow to create a unified developer and user interface for Tomography data processing. VisTrails provides functions to make this happen:
- Provenance: development process are fully tracked, history can be tagged and versioned and be revisited again with preserved settings.
- Parameter exploration: explore a parameter with a range of values, with results presented side-by-side in spreadsheet for easy comparison.
- Wrap commands into modules : write a python source, or use CLT command line tool to wrap executables and run scripts as a module. Once modules are constructed, users can switch different toolsets by “drag and connect” different modules to the current pipeline, the pipeline runs the same way.
- Submit remote jobs: The tej tool provides a way to start job on any remote server through SSH, associate it with an identifier, and monitor its status. When the job is complete, it can download the resulting files through SCP.
- Generate simplified user interface: mashup creates a user interface composed of chosen parameters and a result view.
Workflow structure
The original Mathematica notebook include six sections:
- Initialization: convert to script section-1.m
- Attenuation at the first rotation angle: convert to script section-2.m
- Attenuation: convert to script section-3-raw.m and section-3-attenuation.m
- Make Sinograms: convert to script section-4-shiftcentertest.m and section-4-showslices.m
- Reconstruct the sinograms into slices: convert to script section-5.m
- 3D Volume Plot: convert to script section-6.m
Following the instruction in Review, we have completed an example vistrail to run a bullet data reconstruction project. The complete vistrail include eight workflows, each run one .m script. Users should run these workflows in consecutive order to complete the whole process. This is because the later workflow depends on the output of previous workflow.
Navigate the versions
If you cloned our repo, you can find the vistrail file at
/path/to/LSU-VisTrails/vistrail/bullet-cleanup.vt
Note
The red keyword items in following text are annotated as red rectange in this screenshot image
Open this file in VisTrails. Click the treeview in workspace panel, and click the history tool to show history view in the main panel. You can see all of the workflow versions clearly in this setup. The screenshot below shows the version tagged 5img is chosen.
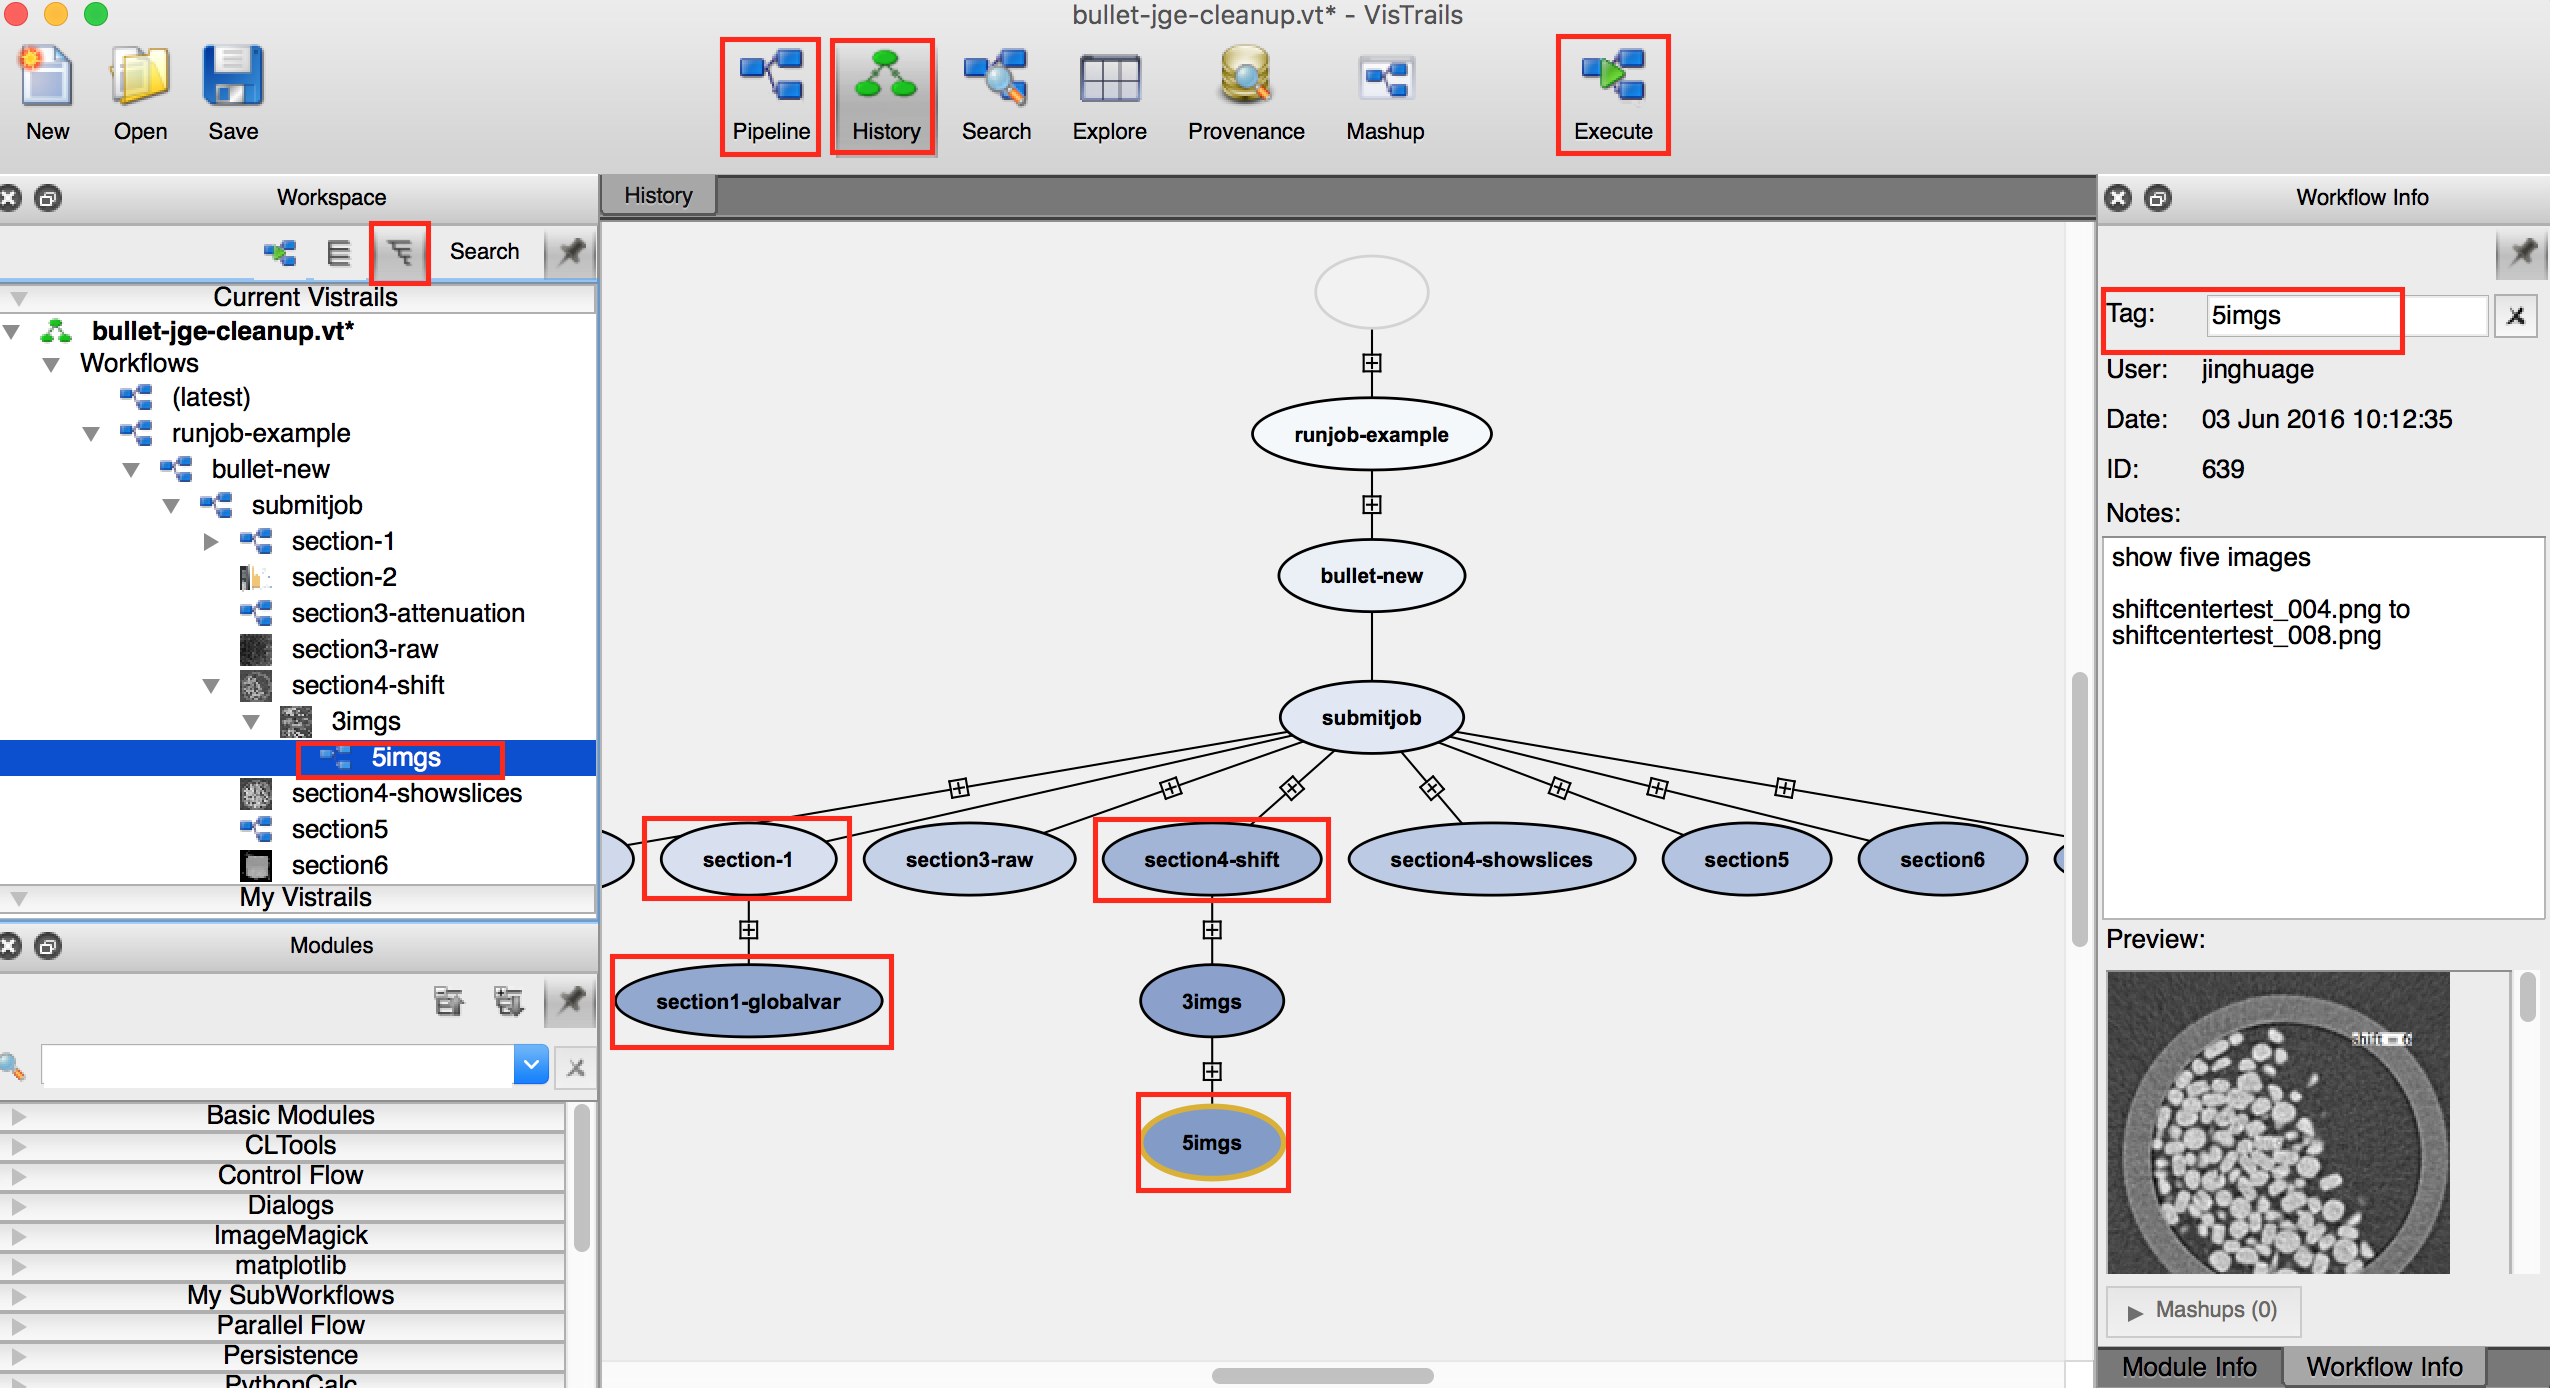
After a version is chosen, click the pipeline tool will show the workflow pipeline in the main panel.
Golbal Variables
Before we run a workflow, let’s introduce the VisTrails global variable. Look back at the prevoius screenshot, notice in the version tree there is a section1-globalvar version underneath section-1 version.
The section-1 workflow is very simple, in its pipeline there are three user-input parameters (String modules datadir, mdir, mathkernel) that are used in every workflow.
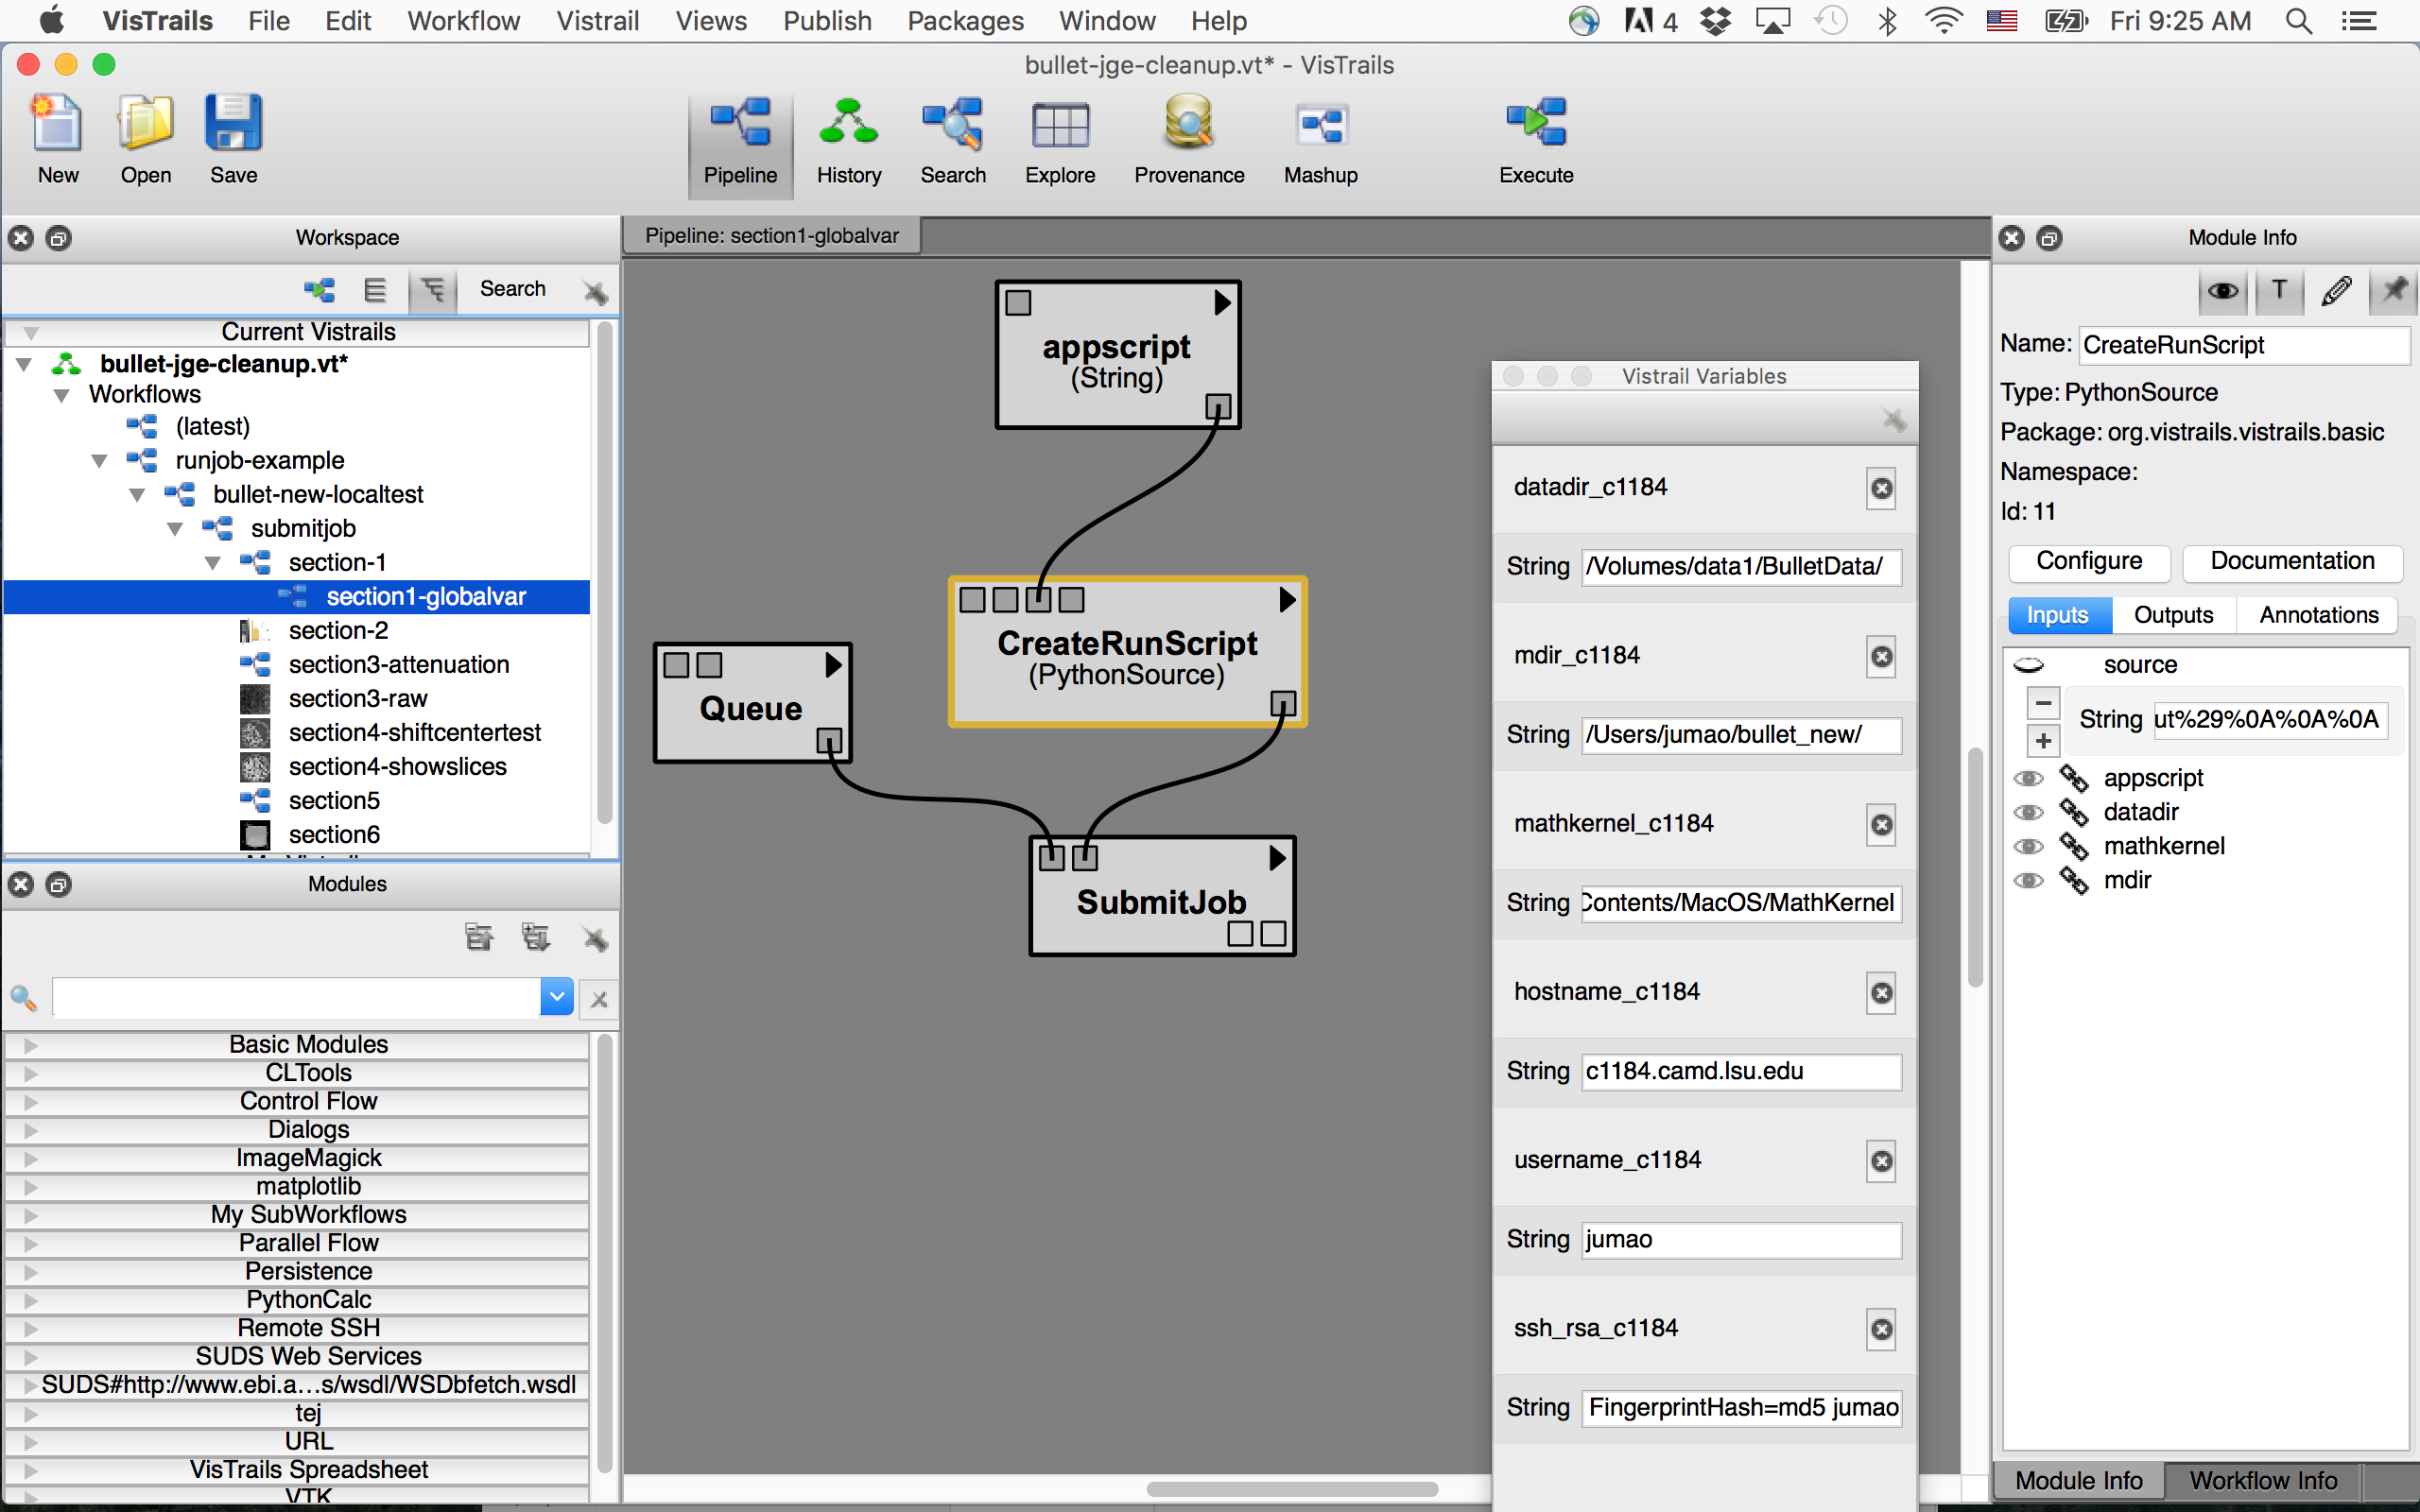
There is option to create global varible for them. (View->VisTrails Variables). Then you can delete the Sting modules and drag the global var to the port.
Similarly, you can also create global vars for module Queue port hostname and username
When use global vars, the pipeline look much cleaner. Below is screenshot:
Run a workflow
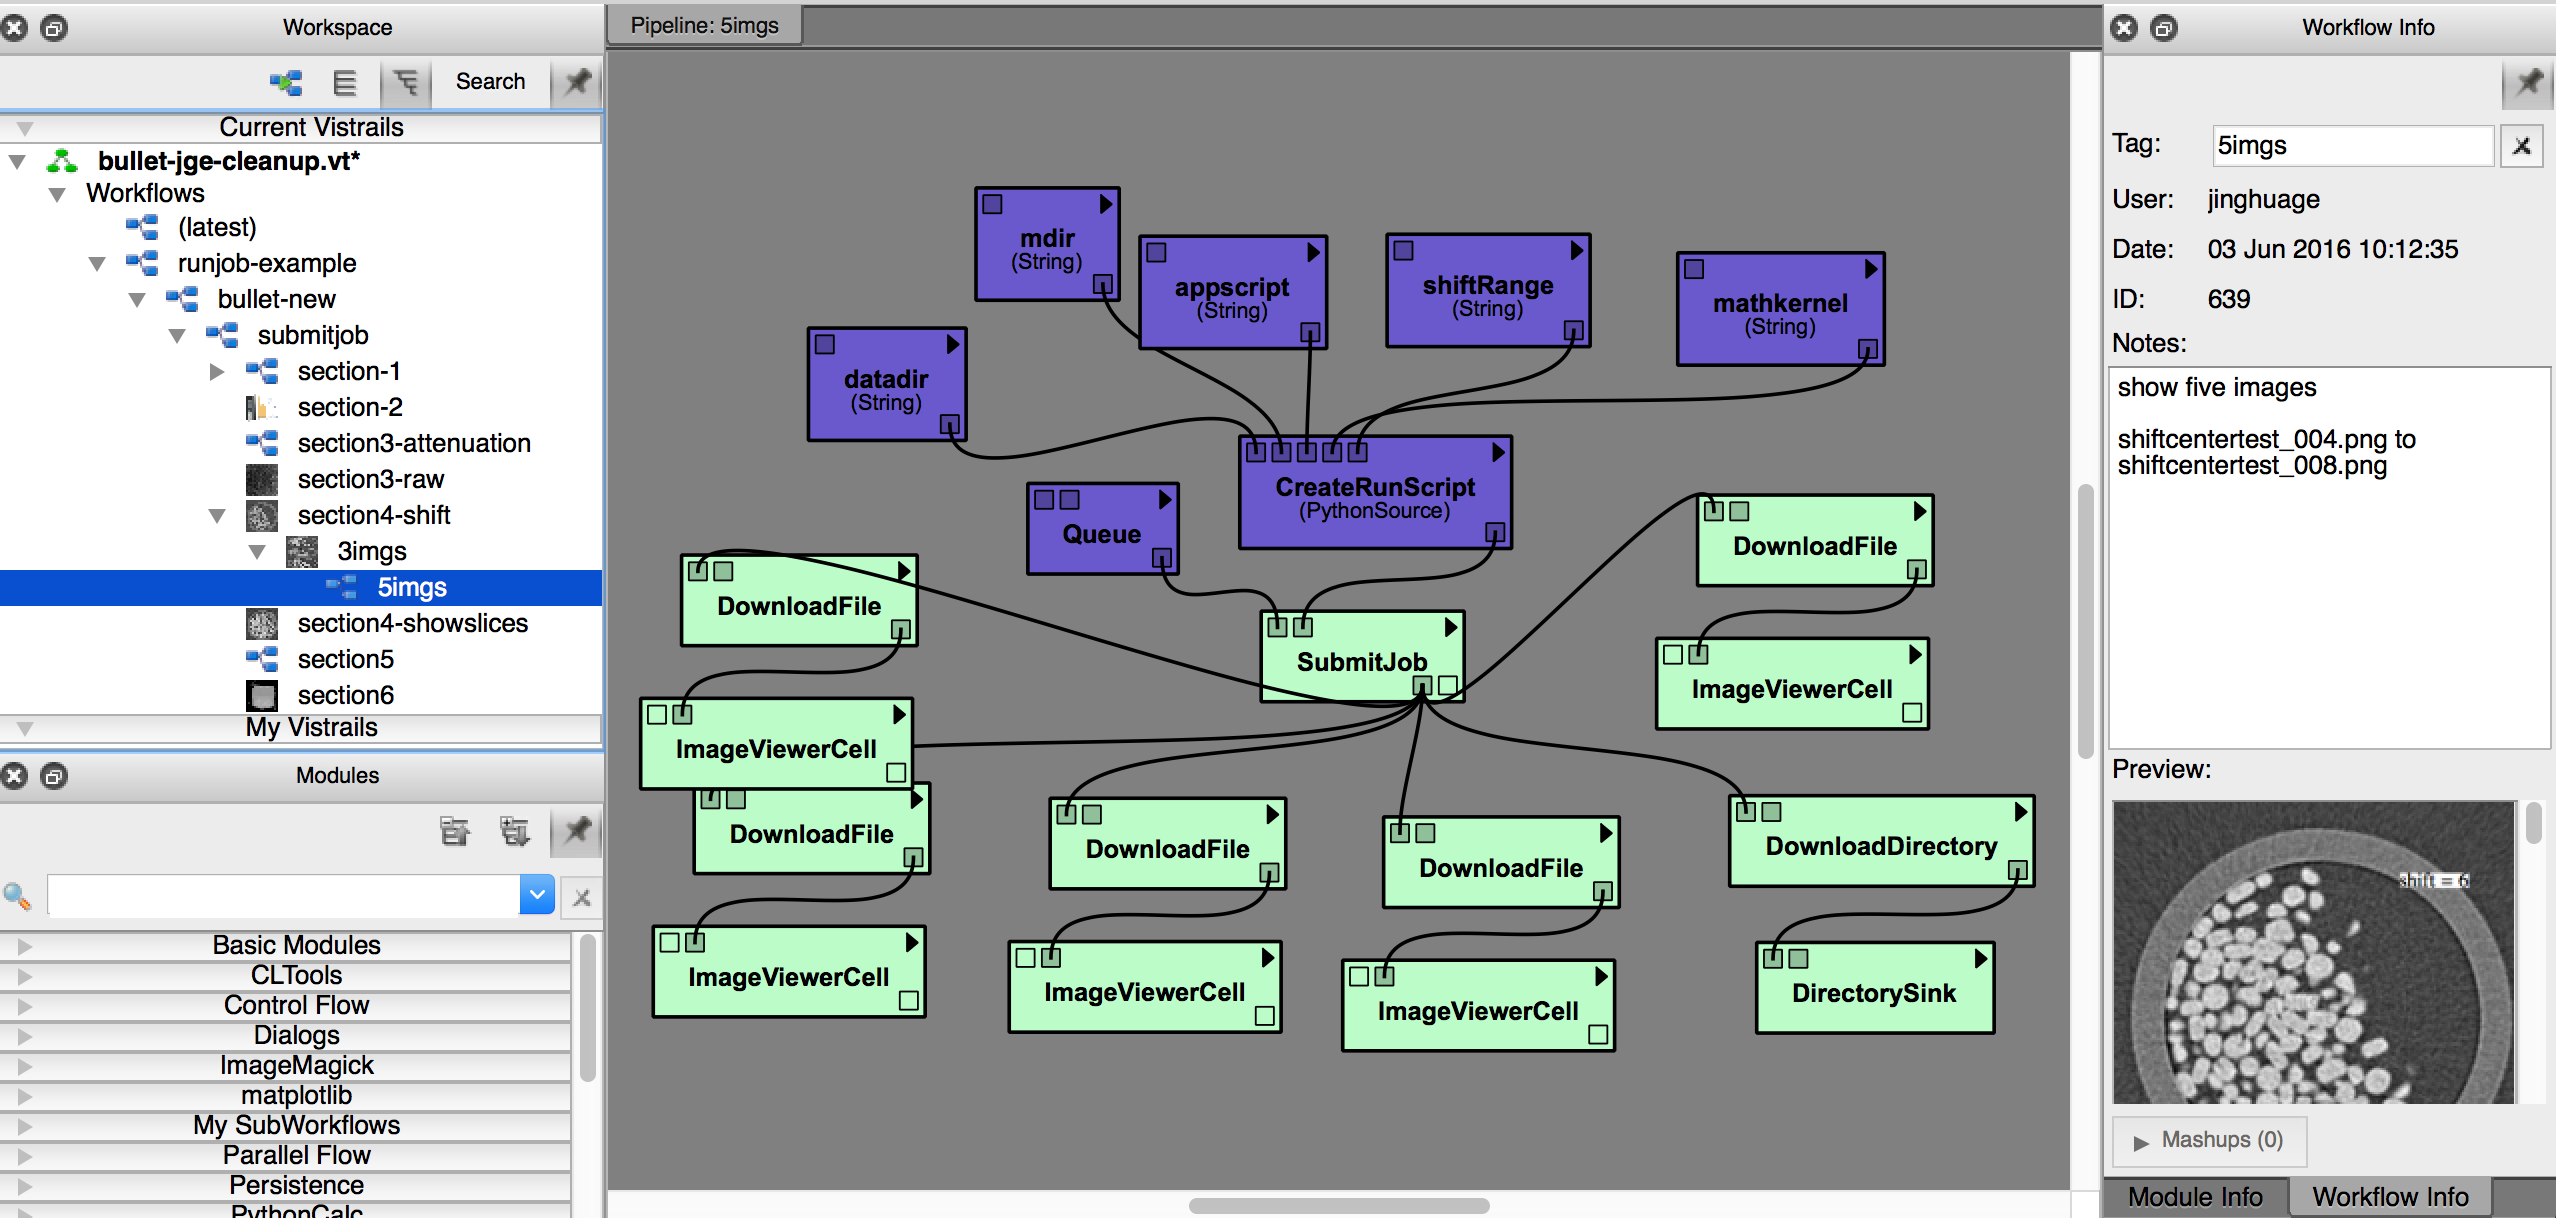
Now we show how to run a workflow and get its results. Either double click a version in workspace tree view, or go to history panel and select a version, then switch back to pipeline view. You should see this workflow’s pipeline modules.
Here we’ll use the 5img version under the section4-shift version as an example.
Change user-input modules
Before you run this workflow, change some parameters to accommodate the data and script path, and your running computer info.
datadir(String): change to where the dataset structure is saved.mdir(String): change to where the .m scripts are savedmathkernel(String): change to Mathmatica kernel in remote computer. In Mac OS X, most probably it’s at : /Applications/Mathematica.app/Contents/MacOS/MathKernelQueue: set hostname and username values in input portsDirectorySink: set local directory for the downloaded directory
After the modules are setup for your run, click Execute in toolbar. The runningjobs panel will showup, telling you that your job is running. Suppose your job will run for a while, you can go do something else for now.
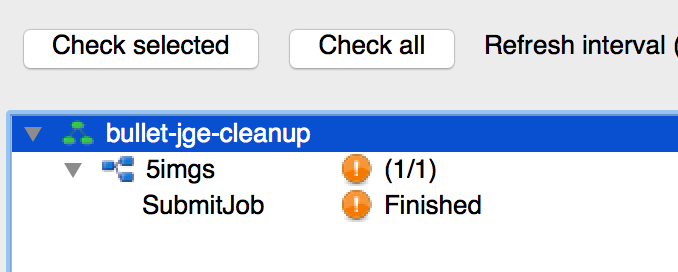
The runningjobs panel show the job status (View->Running Jobs)
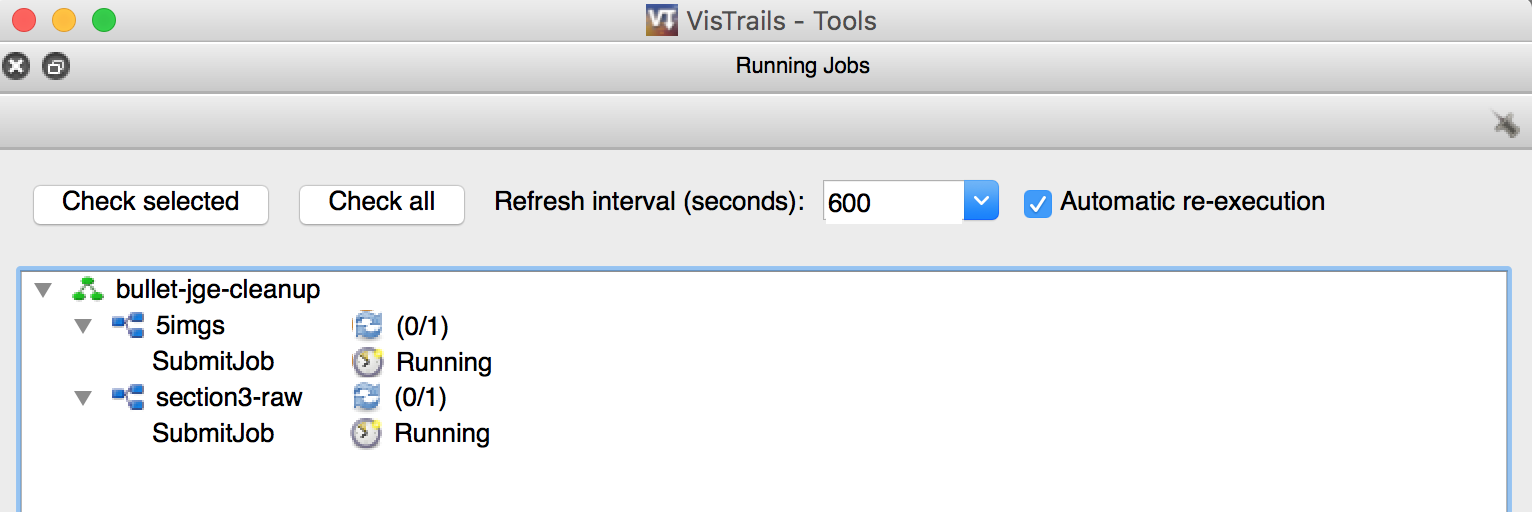
Come back and check results
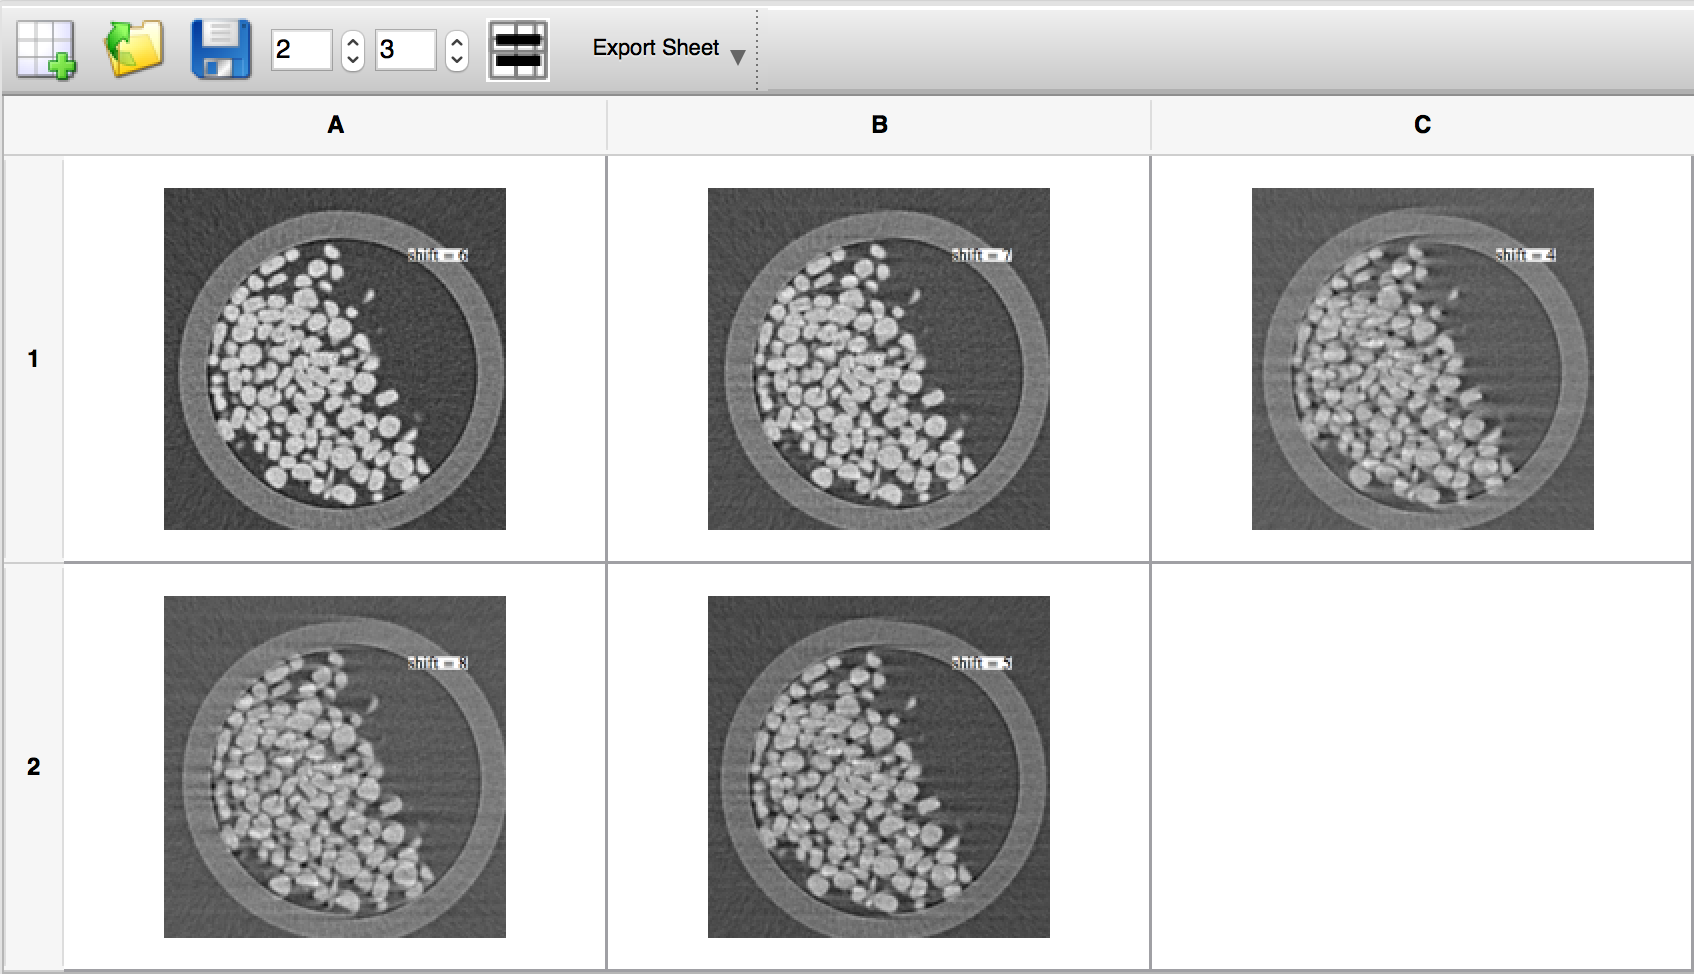
When you come back you should see that your job is finished.
If you click Execute again and nothing has changed, VisTrails will go fetch the cached results and show them in spreadsheet. See the below screenshots for executed pipeline and spreadsheet.
The purple color coded modules means nothing changed and use cached result.
Troubleshoot
If it happens that you want your jobs to run again instead of using the cached results. you can go ahead delete all job status in runningjob panel, and delete the job’s Stage folder as well.