Query
VisIt uses queries to gather quantitative information from the database being visualized.
Connected Components
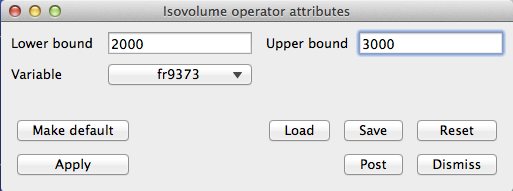
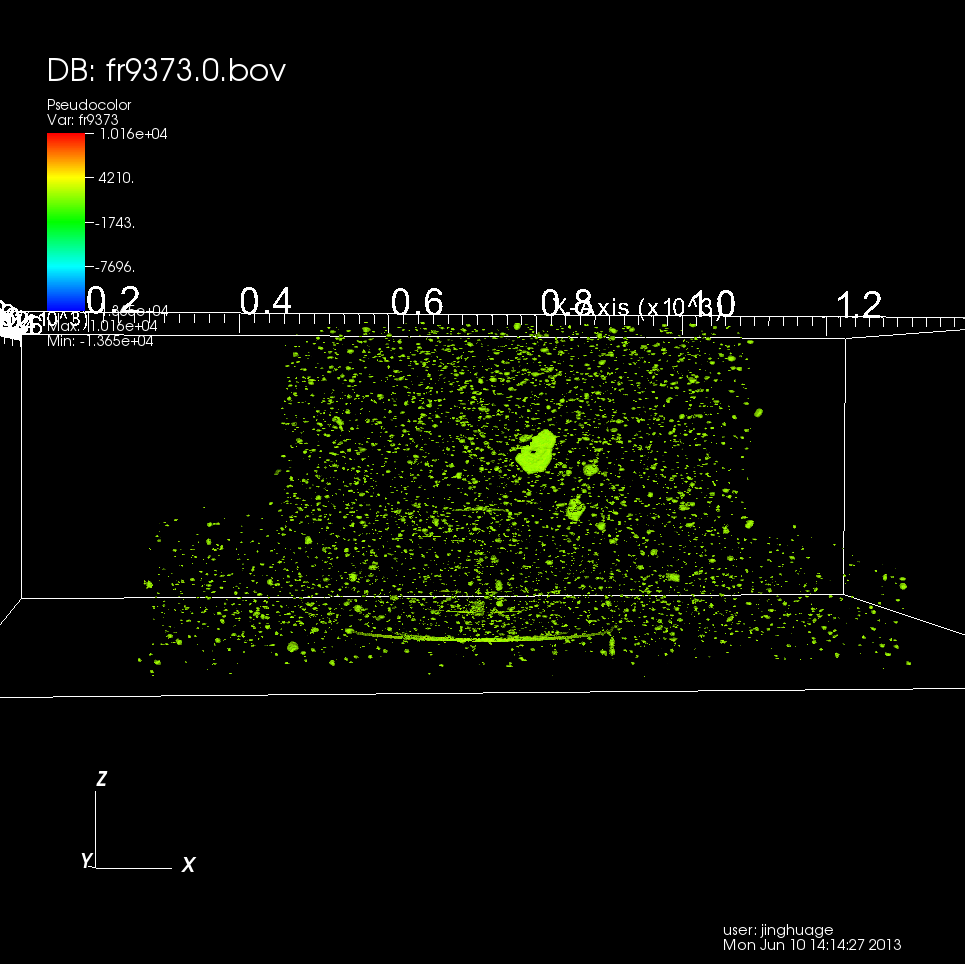
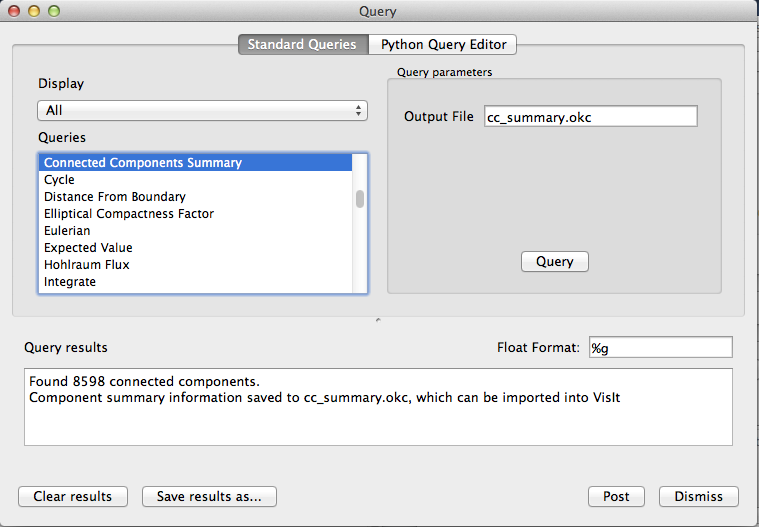
Add a pseudocolor plot, then add an isovolume operator, set min-max value for the isovolume operator, then go to menu, Controls->Query, find “Connected Components Summery”, click “Query” button. The result will be saved into a .okc file, and can be opened in VisIt and plot as histogram. http://visitusers.org/index.php?title=Connected_components
Python code:
OpenDatabase("databasename")
AddPlot("Pseudocolor", "varname")
DrawPlots()
Query("NumNodes")
print "The float value is: %g" % GetQueryOutputValue()
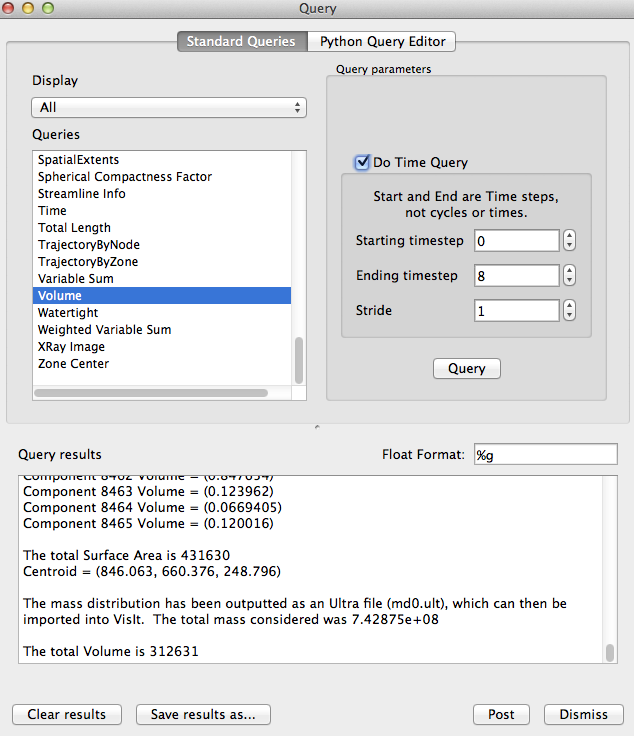
Query over time
check the “Do Time Query” box to enable query over time (very time consuming):
Python code:
for state in range(TimeSliderGetNStates()):
  print state
  SetTimeSliderState(state)
  DrawPlots()

  Query("MinMax")