Create Your Own ColorTable
VisIt ships with a set of pre-defined colortables. A colortable represents how to map a data value into a color in visualization. Usually, a colortable is defined by a list of colors to form a color band, either use continuous interpetation, or just use discrete banding. During the rendering, the color band will be mapped to the data value min-max range, thus each data value will be assigned a corresponding color.
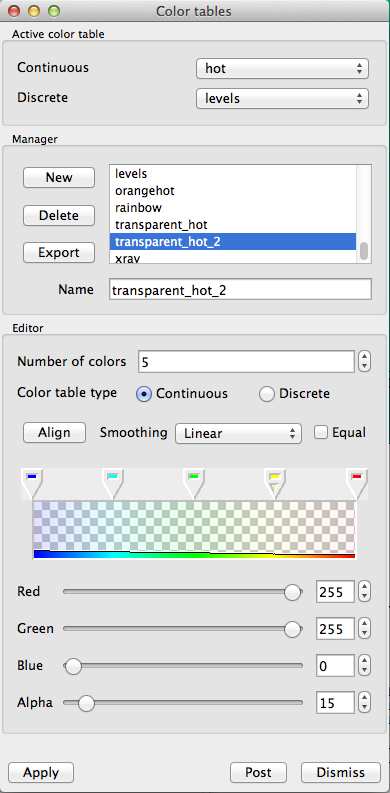
Here is how to create your own colortable in VisIt. Click from menu Controls -> Color table, a “Color tables” dialog will appear. In the “Name” section, enter a new name (must be different from any default colortable name), then click the “New” button. In the “Editor” panel, specify how many colors you want to use to define this colortable, and specify each color using the RGBA sliders. Below is a screenshot where I create a very transparent color table, called “transparent_hot_2”. This colortable will be saved in your local computer:
~/.visit/transparent_hot_2.ct
So, if you want to give someone else your python code or VisIt session of a visualization, and you use the color table you designed, you need to also distribute this file to other users, and ask them to save it in their $HOME/.visit folder.