Use Expression in VisIt
Create Expressions
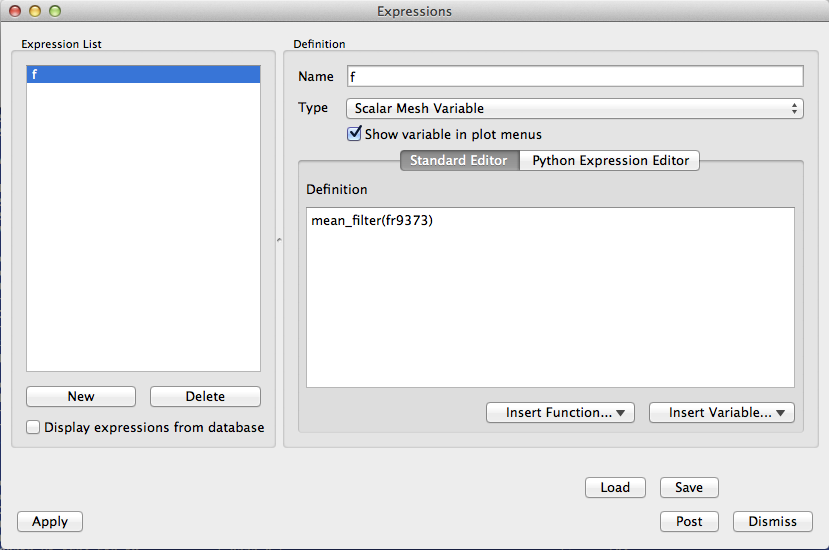
To create expressions from GUI: click from menu Controls->Expressions, the “Expressions” dialog will appear, click “New” button from the bottom of the left side panel, then at the right side panel, give the new expression a name, indicate it’s data type, and define its mathematical equation using the help from “Insert Function...” and “Insert Variable...” buttons. click Apply.
Defer Expression Evaluation
For example, I have a large dataset which contains a scalar variable called “fr9373”. I want to do some de-noising before a volume rendering. I define two new scalars called “f” and “sf”, to do median filter and gaussian filtering separately. Because the dataset is large, I want to apply a box operator, so the volume rendering only render a subset of the whole dataset. After adding a volume rendering plot to scalar “fr9373”, I first add a box operator, then apply a deferred expression and set its variable to “f” or “sf”, then draw the plot. This way, the de-noise filter will only be applied after the Box operator, thus “deferred”.
Python code example:
import visit
import sys


database = "fr9373.*.bov database"


OpenDatabase(database)

DefineScalarExpression("f", "median_filter(fr9373)")
DefineScalarExpression("sf", "conservative_smoothing(fr9373)")


AddPlot("Volume", "fr9373", 1, 1)

AddOperator("Box", 1)
BoxAtts = BoxAttributes()
BoxAtts.amount = BoxAtts.Some
BoxAtts.minx = 460
BoxAtts.maxx = 1220
BoxAtts.miny = 0
BoxAtts.maxy = 1120
BoxAtts.minz = 0
BoxAtts.maxz = 512
SetOperatorOptions(BoxAtts, 1)

AddOperator("DeferExpression", 1)
DeferExpressionAtts = DeferExpressionAttributes()
DeferExpressionAtts.exprs = ("sf")
SetOperatorOptions(DeferExpressionAtts, 1)


DrawPlots()
SaveWindow()

DeleteAllPlots()
CloseDatabase(database)

sys.exit()
