Create Visualization
Note
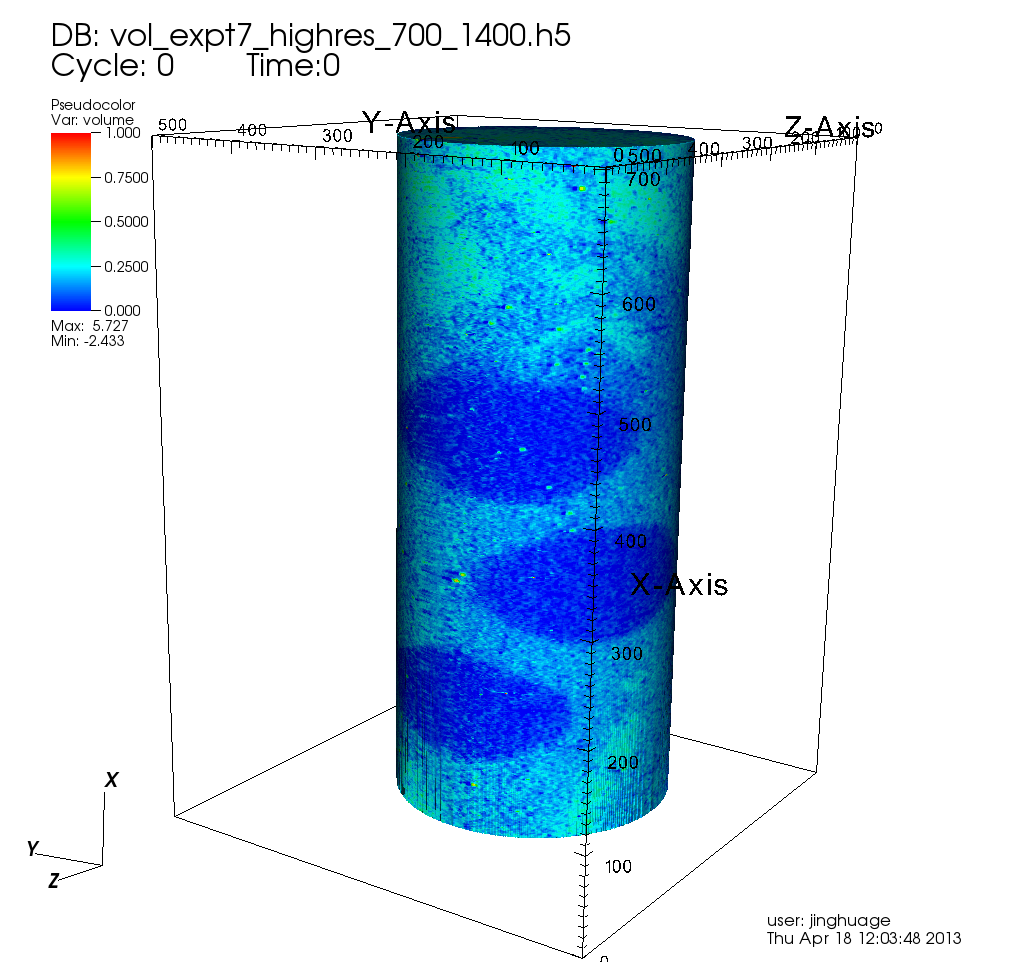
dataset: tezpur.lsu.edu:/project/lbutler/data_materials/hydorgen_Oct2012/vol_expt7_highres_700_1400.h5
In VisIt, a plot is to specify how to render your data into an image, an operator is to specify how to filter your data to reveal features.
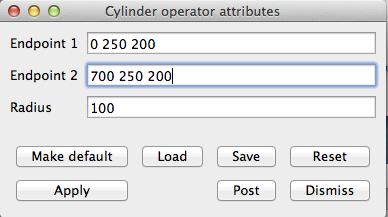
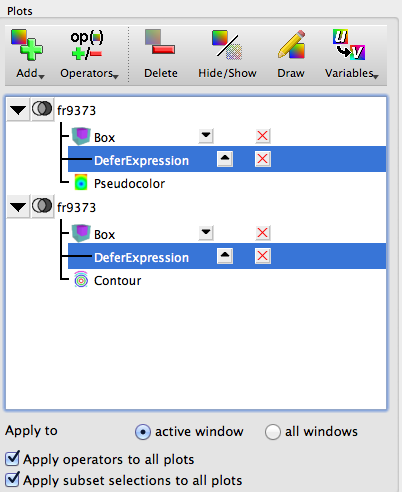
Open dataset, add psuedocolor plot (variable name is “volume”), click operators -> selection -> cylinder, click on the left side triangle to expand the plots and operators list, double click on plot and operator to set attributes.
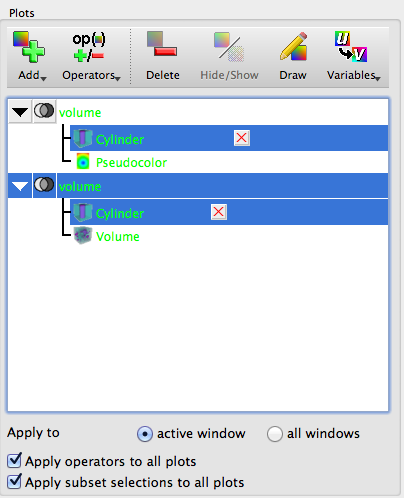
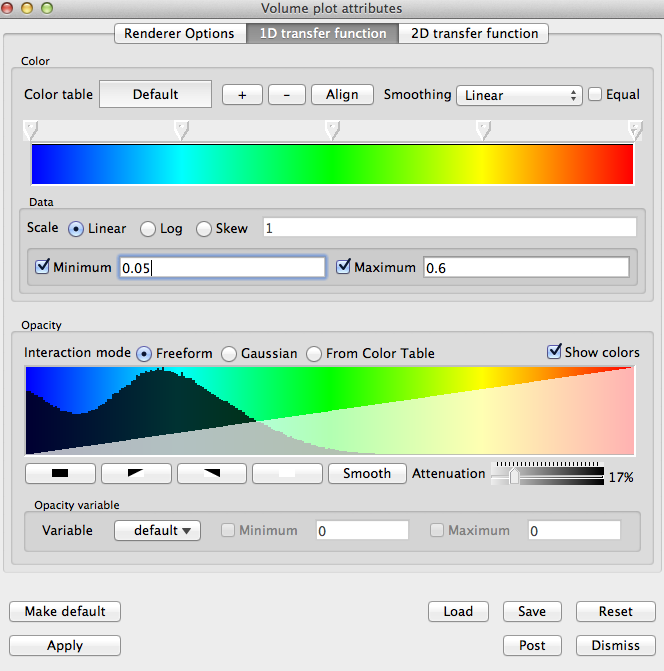
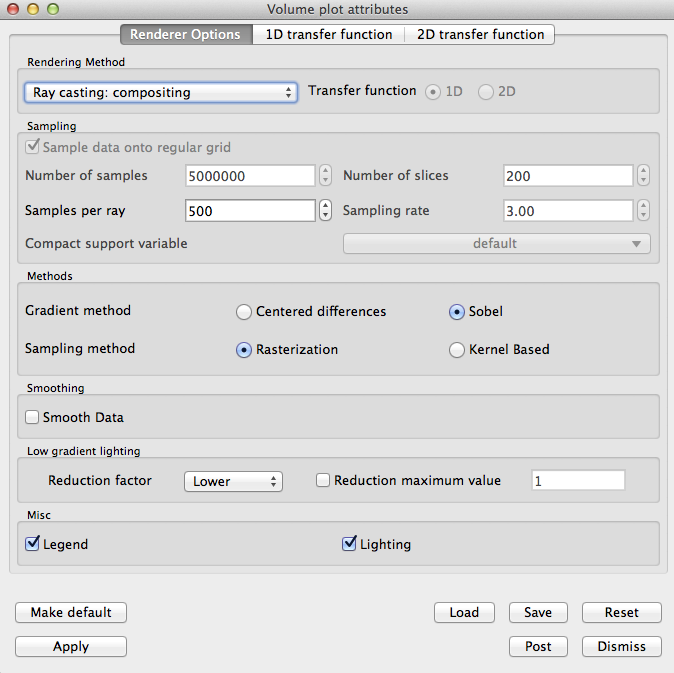
Add Volume plot, with “Apply operators to all plots” checked (this is default). double click on volume plot to set attributes.
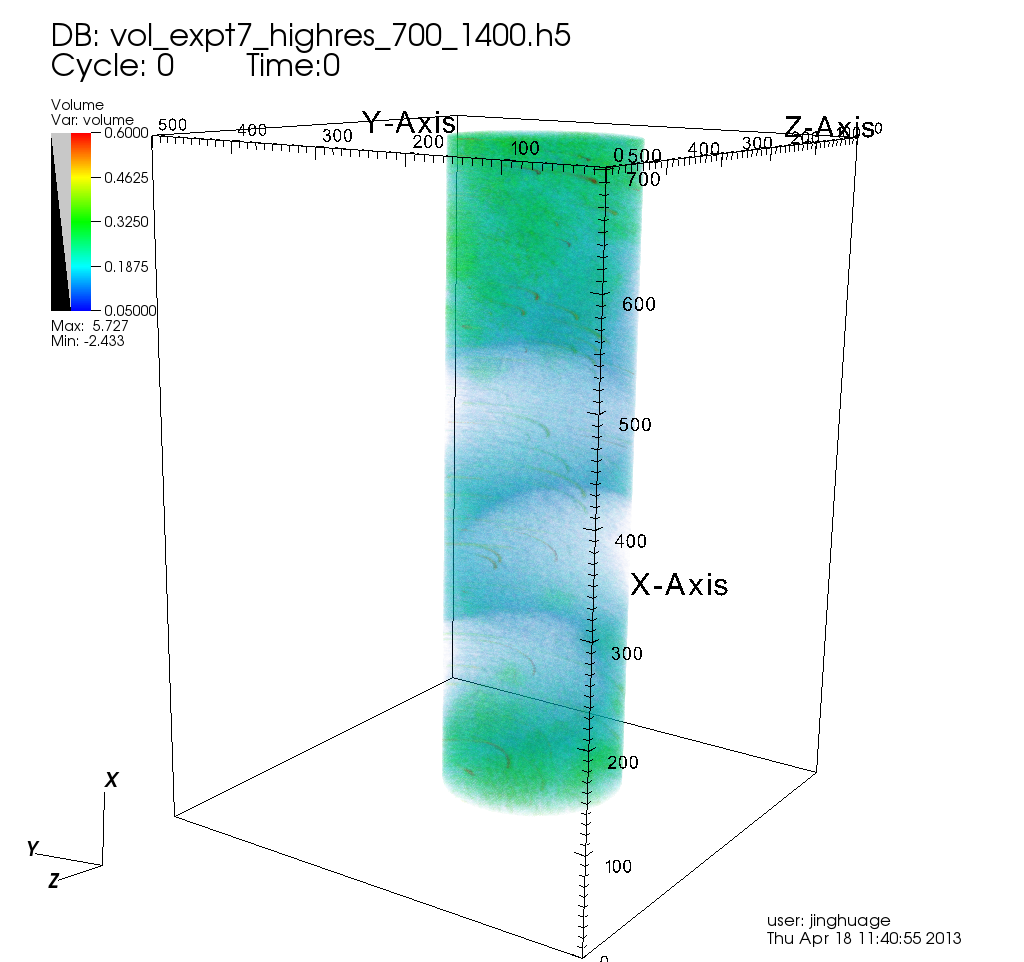
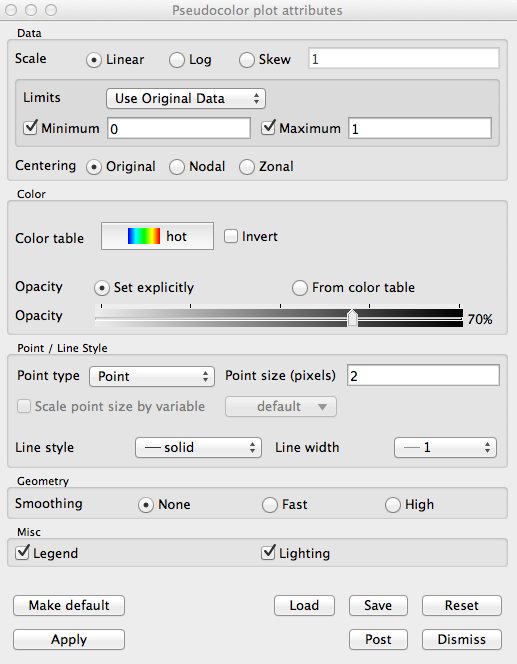
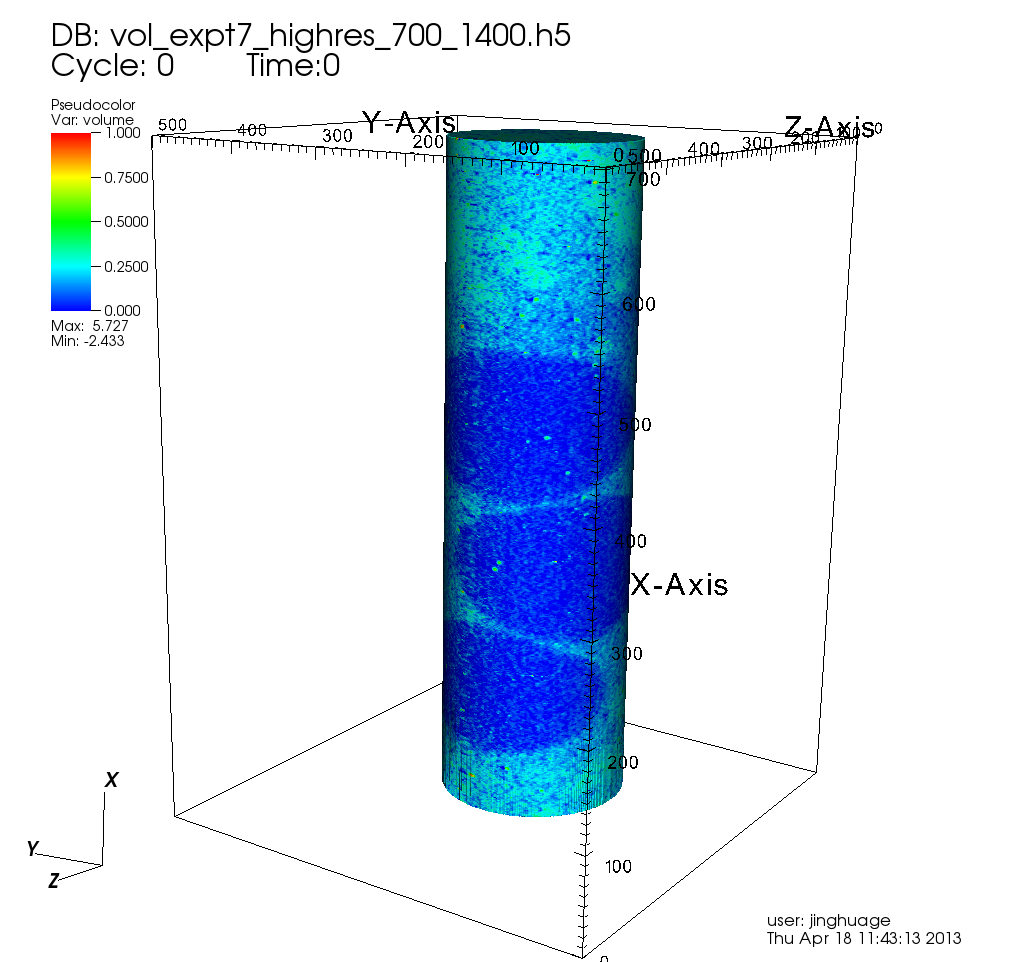
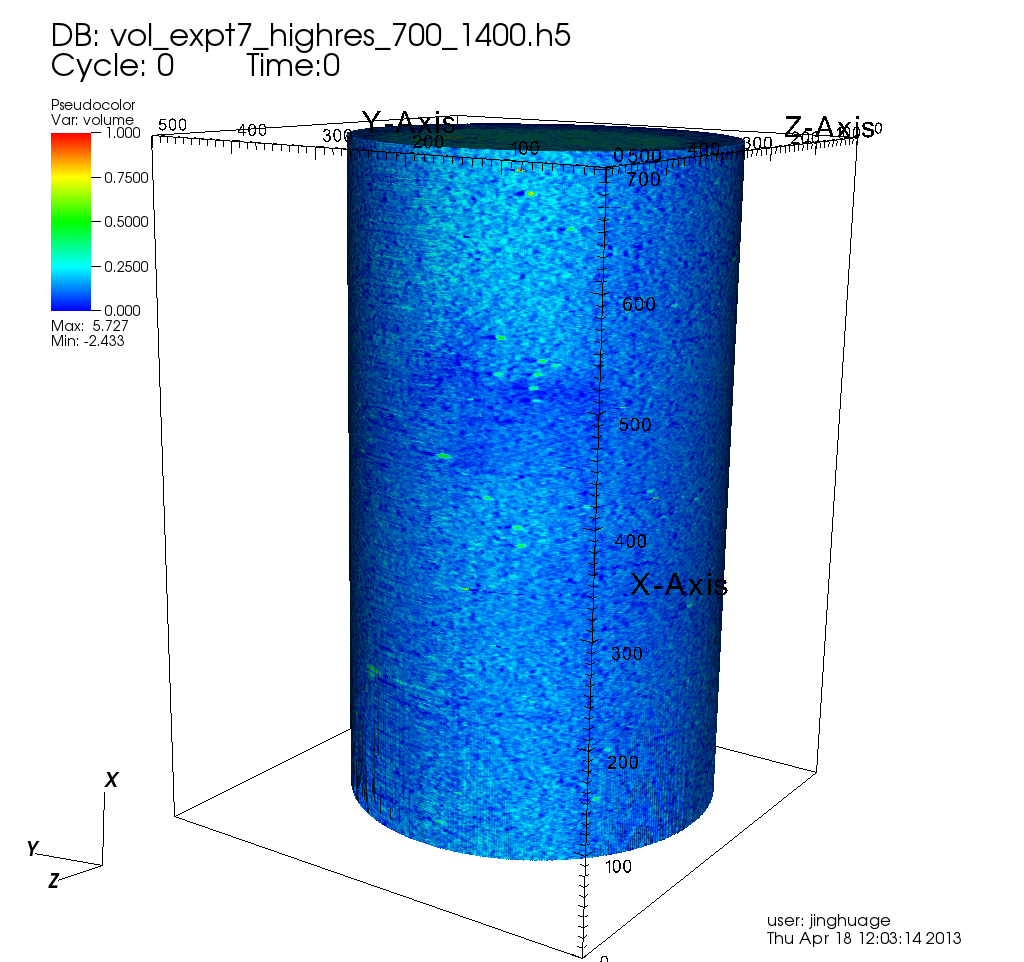
Try to play around, I did some stuff to the pseudocolor plot, (I hide the volume plot for this step), e.g. Change data range min-max, change color table, change cylinder size, switch background/forground color, etc. See below for two example screenshots with different cylinder radius. You can try to encode these changes into a movie.
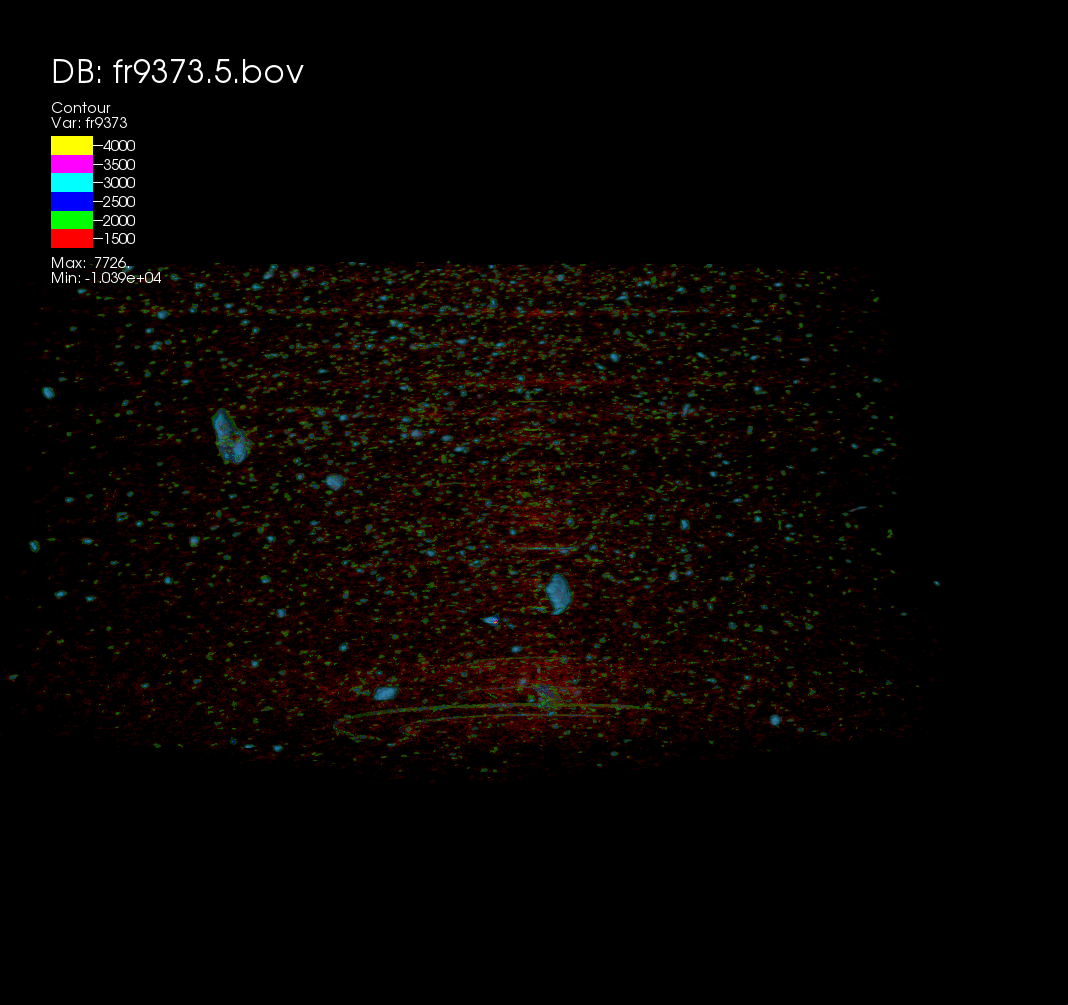
Most used plots for material tomography: pseudocolor, volume, contour; Most used operators: resample, box, cylinder, threshold, isovolume, slice, threeslice, isosurface.
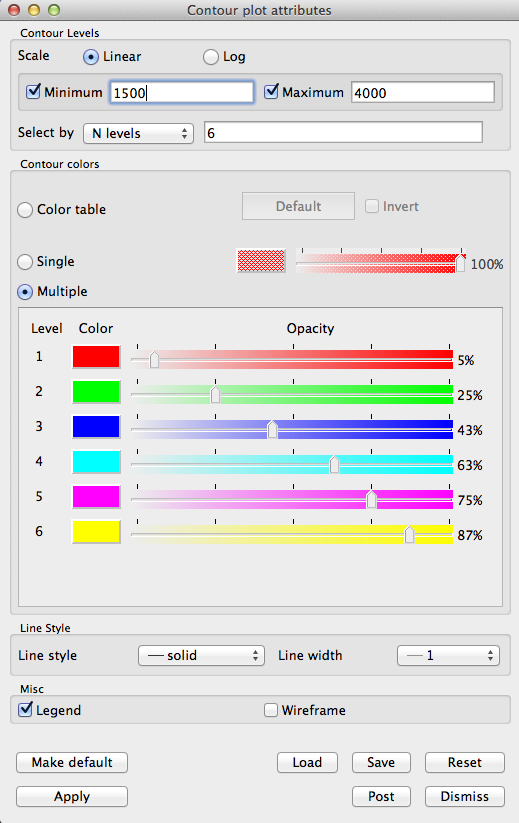
Example Contour plot, and its attributes:
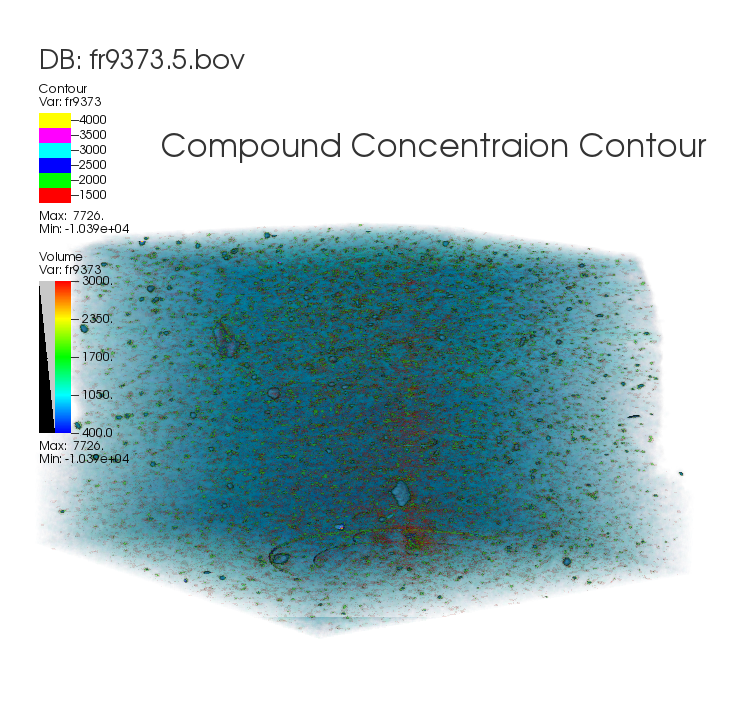
Transparent pesudocolor plot, and Contour plot blending:
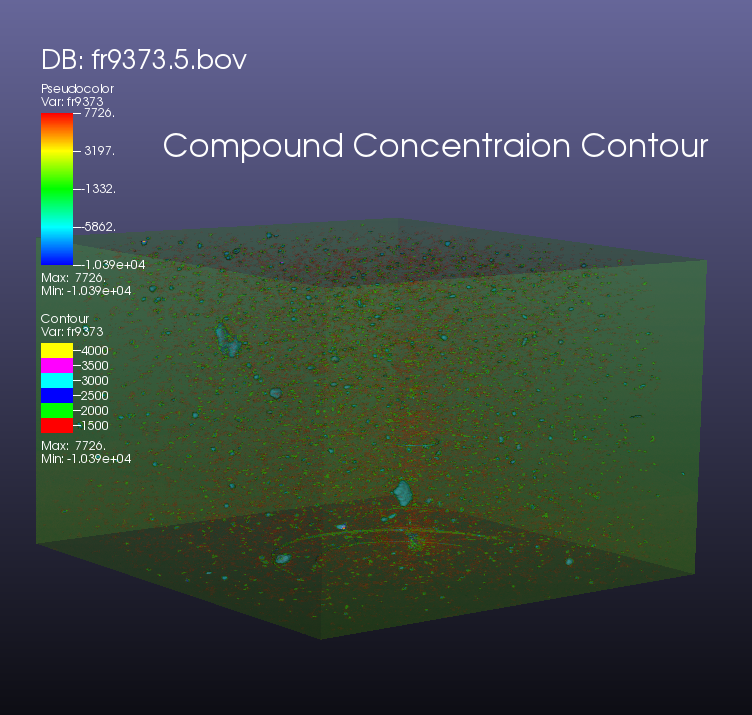
Transparent volume plot, and Contour plot blending:
Viewer window toolbar
The toolbar on top of the viewer window allow you to manage multiple viewer windows, and change interactive mode.

Save and restore from session
Click from menu File->Save session as...., to save the current visualization to a session file to where you specified in your local file system. Next time you can recover the whole session by File->Restore Session..., and choose your saved session file.