Register 3D volumes
Avizo project with sample data
Data description
- Sample: Neutron Images of Titanium 3D print object
- Dataset #1: Full sample, high-res, no grating, absorption image
- Dataset #2: Half sample, low-res, interferometry with grating, absorption and darkfield images
After some cleanup (crop, extract subvolumes) of the two datasets, we have good slices, and similar tight bounding box of the sample, ready to be further processed and compared. Dataset #1 is now about 800x800x607 in 3D dimension, Dataset #2 about 325x315x103. You can see that Dataset #2 is almost 3x3x3 subsample of Dataset #1.
Prepare data
Masking
To remove noise surrounding the sample, we apply a mask:
- Use
Interactive Thresholdmodule to make binary image - Use
Image Morphologymodules (e.g. dilation/erosion) to create a mask - Use
Arithmeticmodule to multiply mask to original data
Extract subvolume
Dataset #2 has two samples stacked together, we separate the sample we need using Extract subvolume module. Do same to both absorption and dark field images.
Crop
Two kinds of cropping are applied with crop editor
- Crop bad slices (glue, not sample)
- Crop the full sample Dataset #1 to contain the same part as half sample Dataset #2
Flip
In crop editor, do “flip z” to Dataset #2, so the vertical direction of the sample matches Dataset #1.
If you go through both dataset slice by slice in sample vertical direction, you should easily see correspondence of the defection regions.
Note
Dataset #1 (high-res) has more slices than Dataset #2 (low-res), but the spatial dimension (slice * voxel size) should be same – they are the same sample physically
Segmentation
Absorption images for both dataset are segmented so we can do auto skeletonization.
Howto:
- open segmentation editor, use magic wand to select the defected region slice by slice
- smooth segmented labels if necessary
Visualization
We mainly use Volume Rending, bounding box, and ortho slice modules for visualization.
To show the defects with volume rendering, we use “volrenWhite” colormap ( or “volrenRed”, “volrenGreen”, in the same category), but set the color used for values greater than max range to be completely transparent (A=0) by clicking the color icon.
For the colormap data range, set the initial values by clicking “Edit -> Adjust rang to -> Data window” first, then adjust manually using the slider. See table below for numbers used in this tutorial.
| dataset | colormap min range | colormap max range | alpha |
|---|---|---|---|
| Dataset #1 abs image | data window min | 1.28 e-03 | 0.1 |
| Dataset #2 abs image | 2.84 e-03 | 2.95 e-03 | 0.25 |
| Dataset #2 df image | 1.36 e-03 | data window max | 1 |
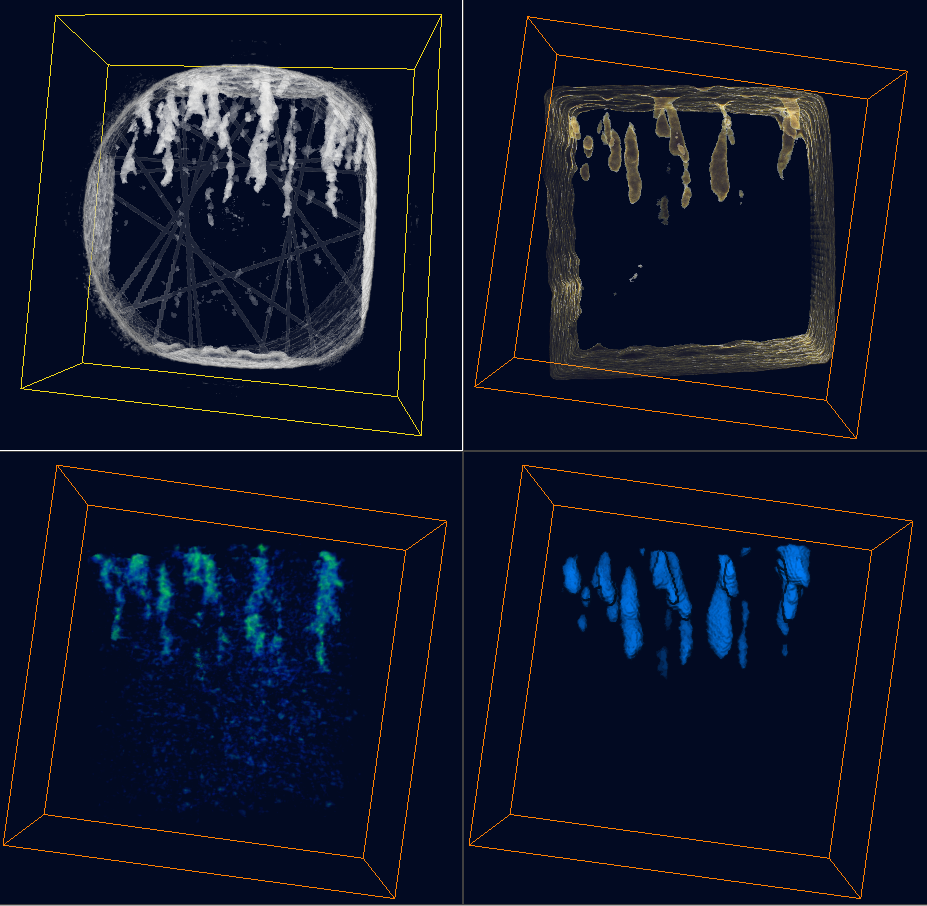
The screenshot below is a split-window view of Dataset #1 (top-left) and Dataset #2 (top-right:abs, bottom-left:darkfield, bottom-right:label), visualized with volume rendering and bounding box.
About colormap legend
The Avizo colormap editor works great, but when you want to save the current colormap and plot its legend, some bugs are present and may cause confusion to users. Here is a workaround I use to get a reasonable colormap legend plot:
Select “volume rendering” module, in its “Properties” panel, adjust colormap range so your volume rendering looks good. Then click Colormap -> Edit -> Options -> Edit colormap. The colormap editor window will show up. At the top left corner, click the “save colormap” icon, save to your project folder. The saved colormap module will show up in your Project view, but when you select this module, the range shown at its “Properties” ports sometimes are not the same! Don’t panic. Here is what you do:
- Make sure the port Datafield is set to “NO SOURCE”.
- Go ahead and edit the port range boxes (left and right) so it’s the same as the corrent range you are using
- Click the “connect” icon (right arrow in a circle) from colormap module, choose
Annotate -> Colormap Legendmodule, then click “create”. The legend will show up in view window, and you can configure how it looks from its “Properties” panel ports.
Manual registration
Reference: Avizo user guide (version 9), Chapter 6.1 Getting started with spatial data registration using the Transform Editor
Howto:
- Use Dataset #1 as reference, don’t transform this data
- Open transformation editor for Dataset #2, use the “Transformer” tool to translate/rotate/iso-scale the data until it matches closely to Dataset #1
Note
Click the “3D cube wireframe with green nodes” icon in the “Properties” panel toolbar to open the transformation editor. Click the icon again to close it. You can Copy/Paster transform data between different datasets
Auto registration
After manual registration to a fairly close point, we use auto registration to refine the result.
Reference: Avizo user guide (version 9), Chapter 6.4 Registration of 3D image data sets
After many trying, turns out registration using abs or darkfield data directly don’t work. On the other hand, use segmented data (label) for registration gives pretty good result, once manual registration is relatively close. This is not bad, consider we need to do segmentation anyway, and we expect better segmenation to result in better registration.
Add Register Image module to label data (segmented binary) of Dataset #2. Set the ports like below:
- Model: the data to be transformed by registration – label data of dataset #2
- Reference: the data to be registered to – label data of dataset #1
- Metric: “Normalized mutual information” or “correlation”
- Transform: “rigid”, and “iso” if you want scale
- Action: “register” (don’t use “align centers” and “align principle axes” in this case)
The lattice and transform data of Dataset #2:
- Lattice info: 103 x 325 x 315, uniform coordinates
- voxel size: 1 x 1 x 1
- translation: 169.677 32.4205 -245.503
- rotation: 0.594714 -0.523558 0.610083 125.351
- scaleFactor: 2.6023 2.60231 2.60232
- scaleOrientation: 0.890414 -0.259096 -0.374208
- center: 205 372 507
Landmark-based registration
Reference: Avizo user guide (version 9), Chapters
- 6.3 Registration with landmarks, warping surfaces and image.
- 6.3.1 Creating landmark sets
- 6.3.2 Registration with Rigid Transformation