Student Project showcase HNRS3035 Spring‘11
Faculty: Dr. Leslie G. Butler, Department of Chemistry; Dr. Dominique Homberger, Department of Biology
Visualization Consultant: Dr. Jinghua Ge, Center for Computation & Technology
Software: Avizo, Mathematica
Measuring and Calculating Distance: By Cameron Kilchrist
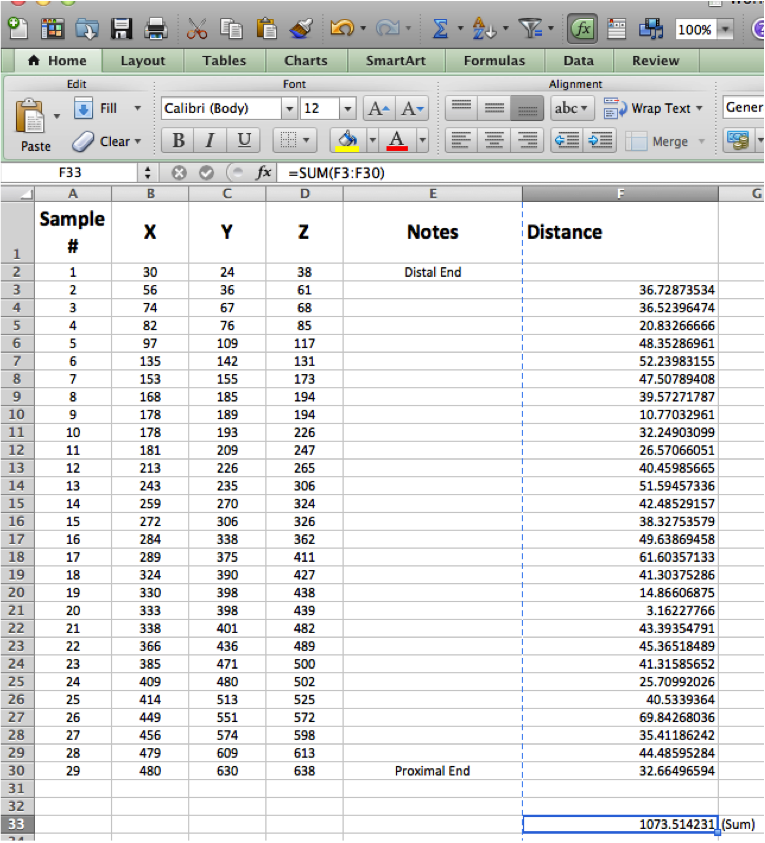
Avizo can measure straight line distance between two points, but not along complex curves or paths. The reality is that nerves, tendons, muscles, blood vessels, and even many bones are not exactly linear. To measure distance on such objects, one approach is to pick discrete samples and integrate the distances between consecutive samples. In the real world, this sampling must be carefully done by hand by someone who understands the dataset. Mathematica is used to explore the symbolic representation of distance measurement on curves.
Volume Edit and Thresholding: By Elise Orellana
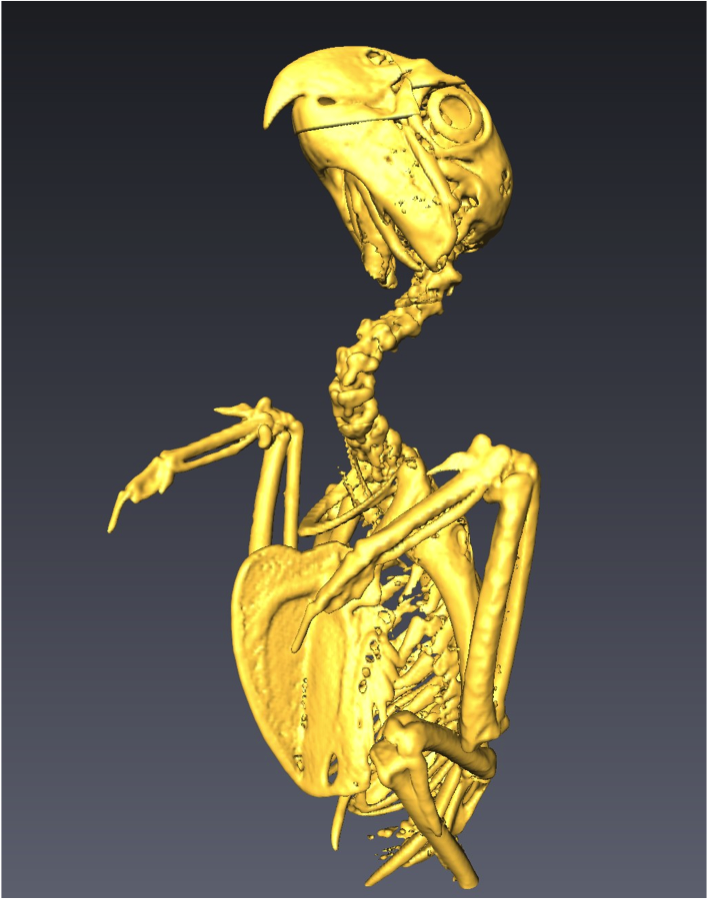
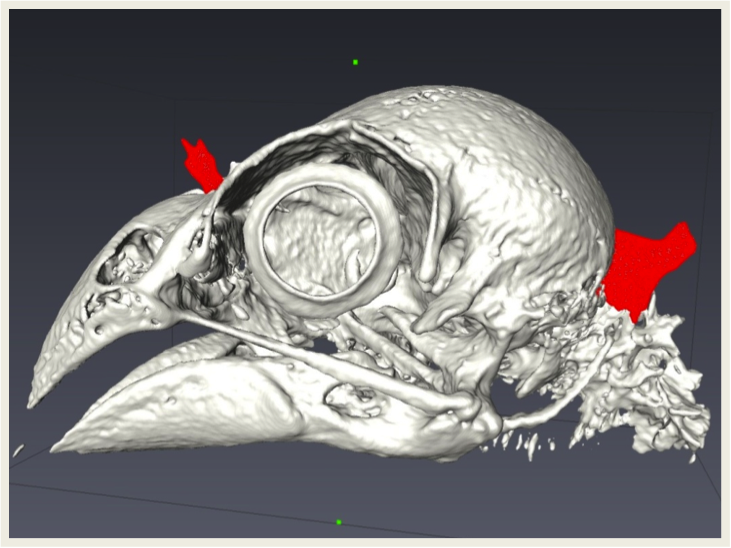
Applying different threshold values to produce isosurfaces of a 3D dataset is a useful technique. Although, experiments in Avizo shows that not a single threshold value can satisfy the goal to reveal a clean skeleton of a CT scan bird. For example, the threshold value which produces a smooth head bone structure also brings fair amount of noise in the body section. This project thus uses the volume edit tool to extract clean parts from three instances of isosurfaces produced from different threshold values. The final result is a complete clean skeleton structure assembled from pieces.
The Use of Metal Markers In 3D Imaging: By Caroline Blevins
Two 3D CT scan datasets are studied, one with metal markers for alignment coordination, the other without markers. Visualization shows that data artifacts radiate from the metal markers are difficult to remove by thresholding or noise reduction. Even after removal of markers using manual segmentation in Avizo, image quality is poor, correct structure is hard to recover.
Using 3D Reconstruction to Illustrate the Cranio-cervical Envelope in the Alligator: By Brooke Hopkins
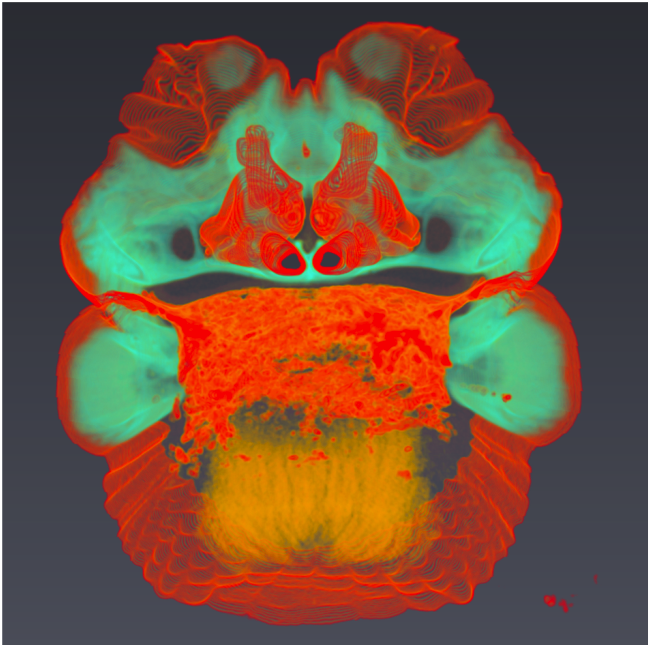
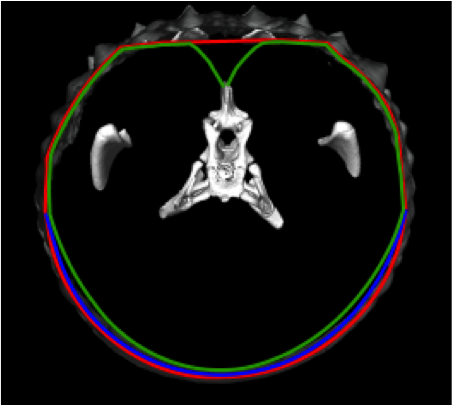
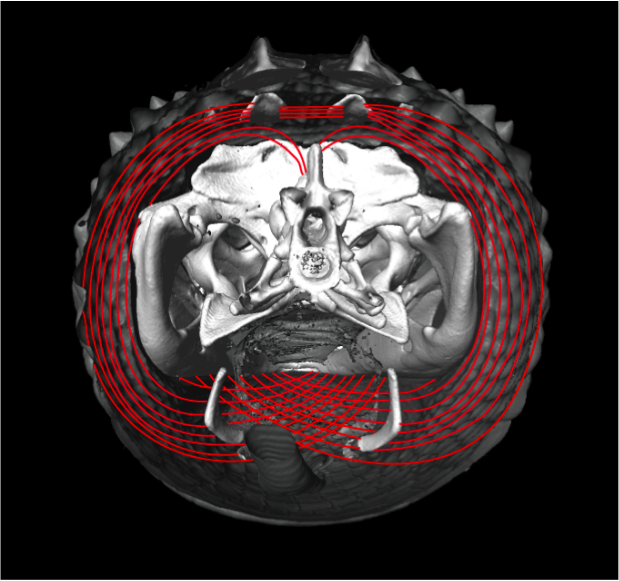
Use Avizo 3D rendering techniques to illustrate the construction of skin, superficial fascia and constrictor musculature of a CT scan alligator. Volume rendering with hand-tuned colormap provides an excellent visualization of fat body distribution of the Alligator dataset; Data value contrast displays relationships of the superficial fascia laminae to other structures in 3D. Other visualization methods include side-by-side comparison with magnified cross-section specimen slice imaging, and extraction of fiber direction contours using a multi-slice model across the 3D dataset.
Visualization and Analysis of the Human Shoulder Suspensory Apparatus: By Michelle Osborn
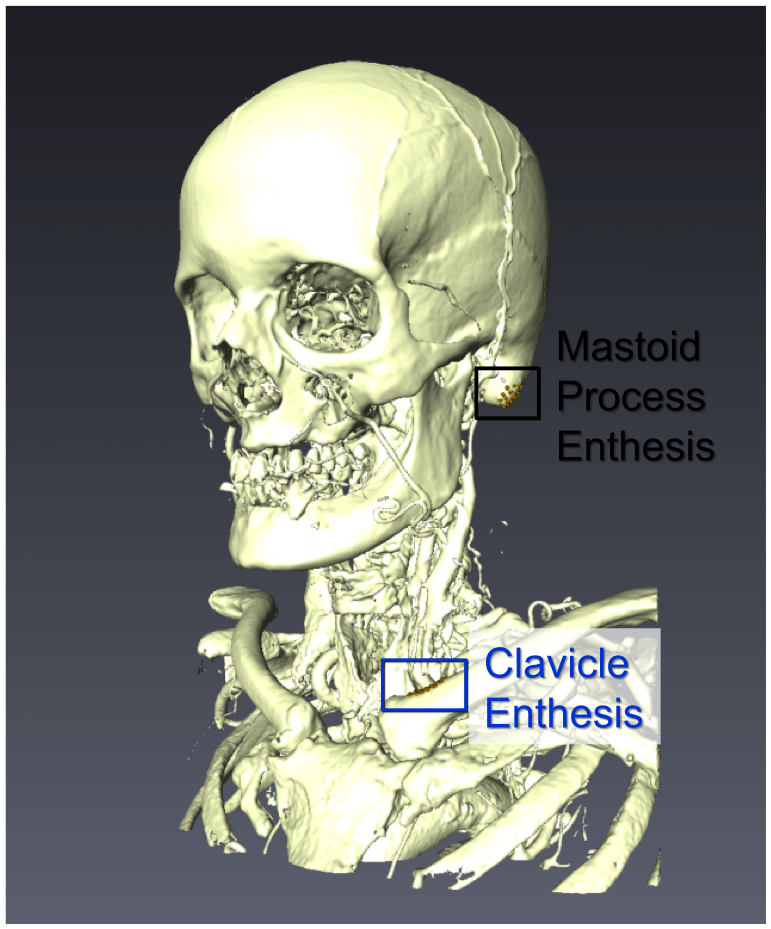
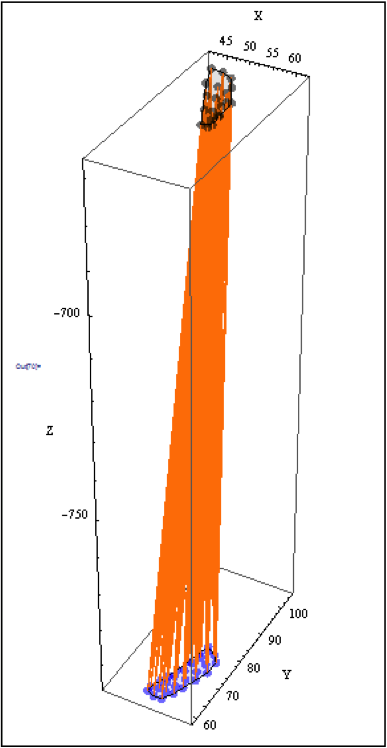
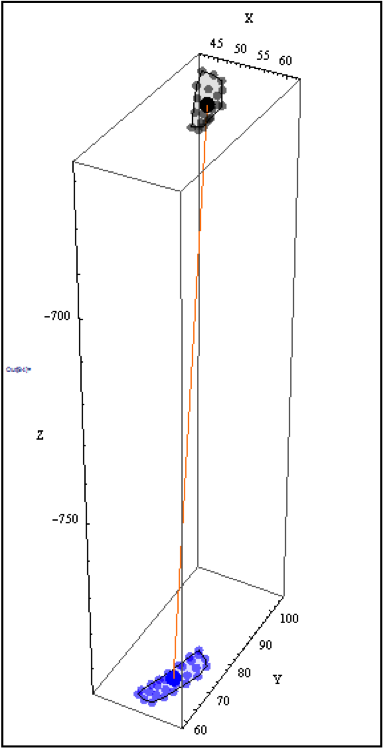
This project measures the length of the clavicular portion of the sternocleidomastoid muscle, as part of human shoulder suspensory apparatus. First, a fairly clean skeleton is extracted from a 3D human head and shoulder CT scan dataset, using the threshold and VolumeEdit techniques. Then, landmark clusters are hand-picked to represent the two entheses for the SCM-C muscle attachment. The landmarks’ x, y, z coordinates are then exported from Avizo into Mathematica to create two point surface patches. Two methods are used to measure the distance between the two point sets, one is Monte Carlo method randomly connects points of the two entheses, the other is single connection between the center of mass of the two entheses.
Detecting Myoseptal Tissue in a Lamprey: By Bradley Wood
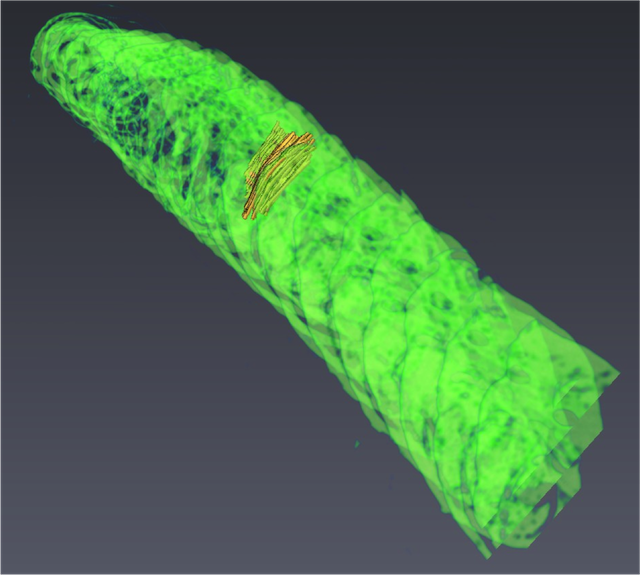
Avzio was used for 3D reconstruction of soft tissues in the lamprey, specifically the myosepta separating the myomeres. Data obtained from microdissection was used to guide the precise identification of the location and 3D structure of the myosepta. By the segmentation module, the myosepta were labeled to aid in understanding their structure and function within the lamprey.
Combining X-ray and Neutron Data Sets: By Dominique Gautreau
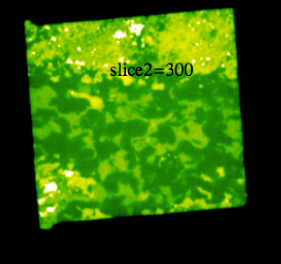
Because neutron and x-rays interact with a sample variously, imaging the same sample with each technique will reveal various details. Combining the data acquired from x-ray and neutron source tomography would allow for more internal as well as surface detail to be displayed, simultaneously. Mathematica is used to explore the statistical advantages to each data set and to determine a weighted combination function.
