Python webapps
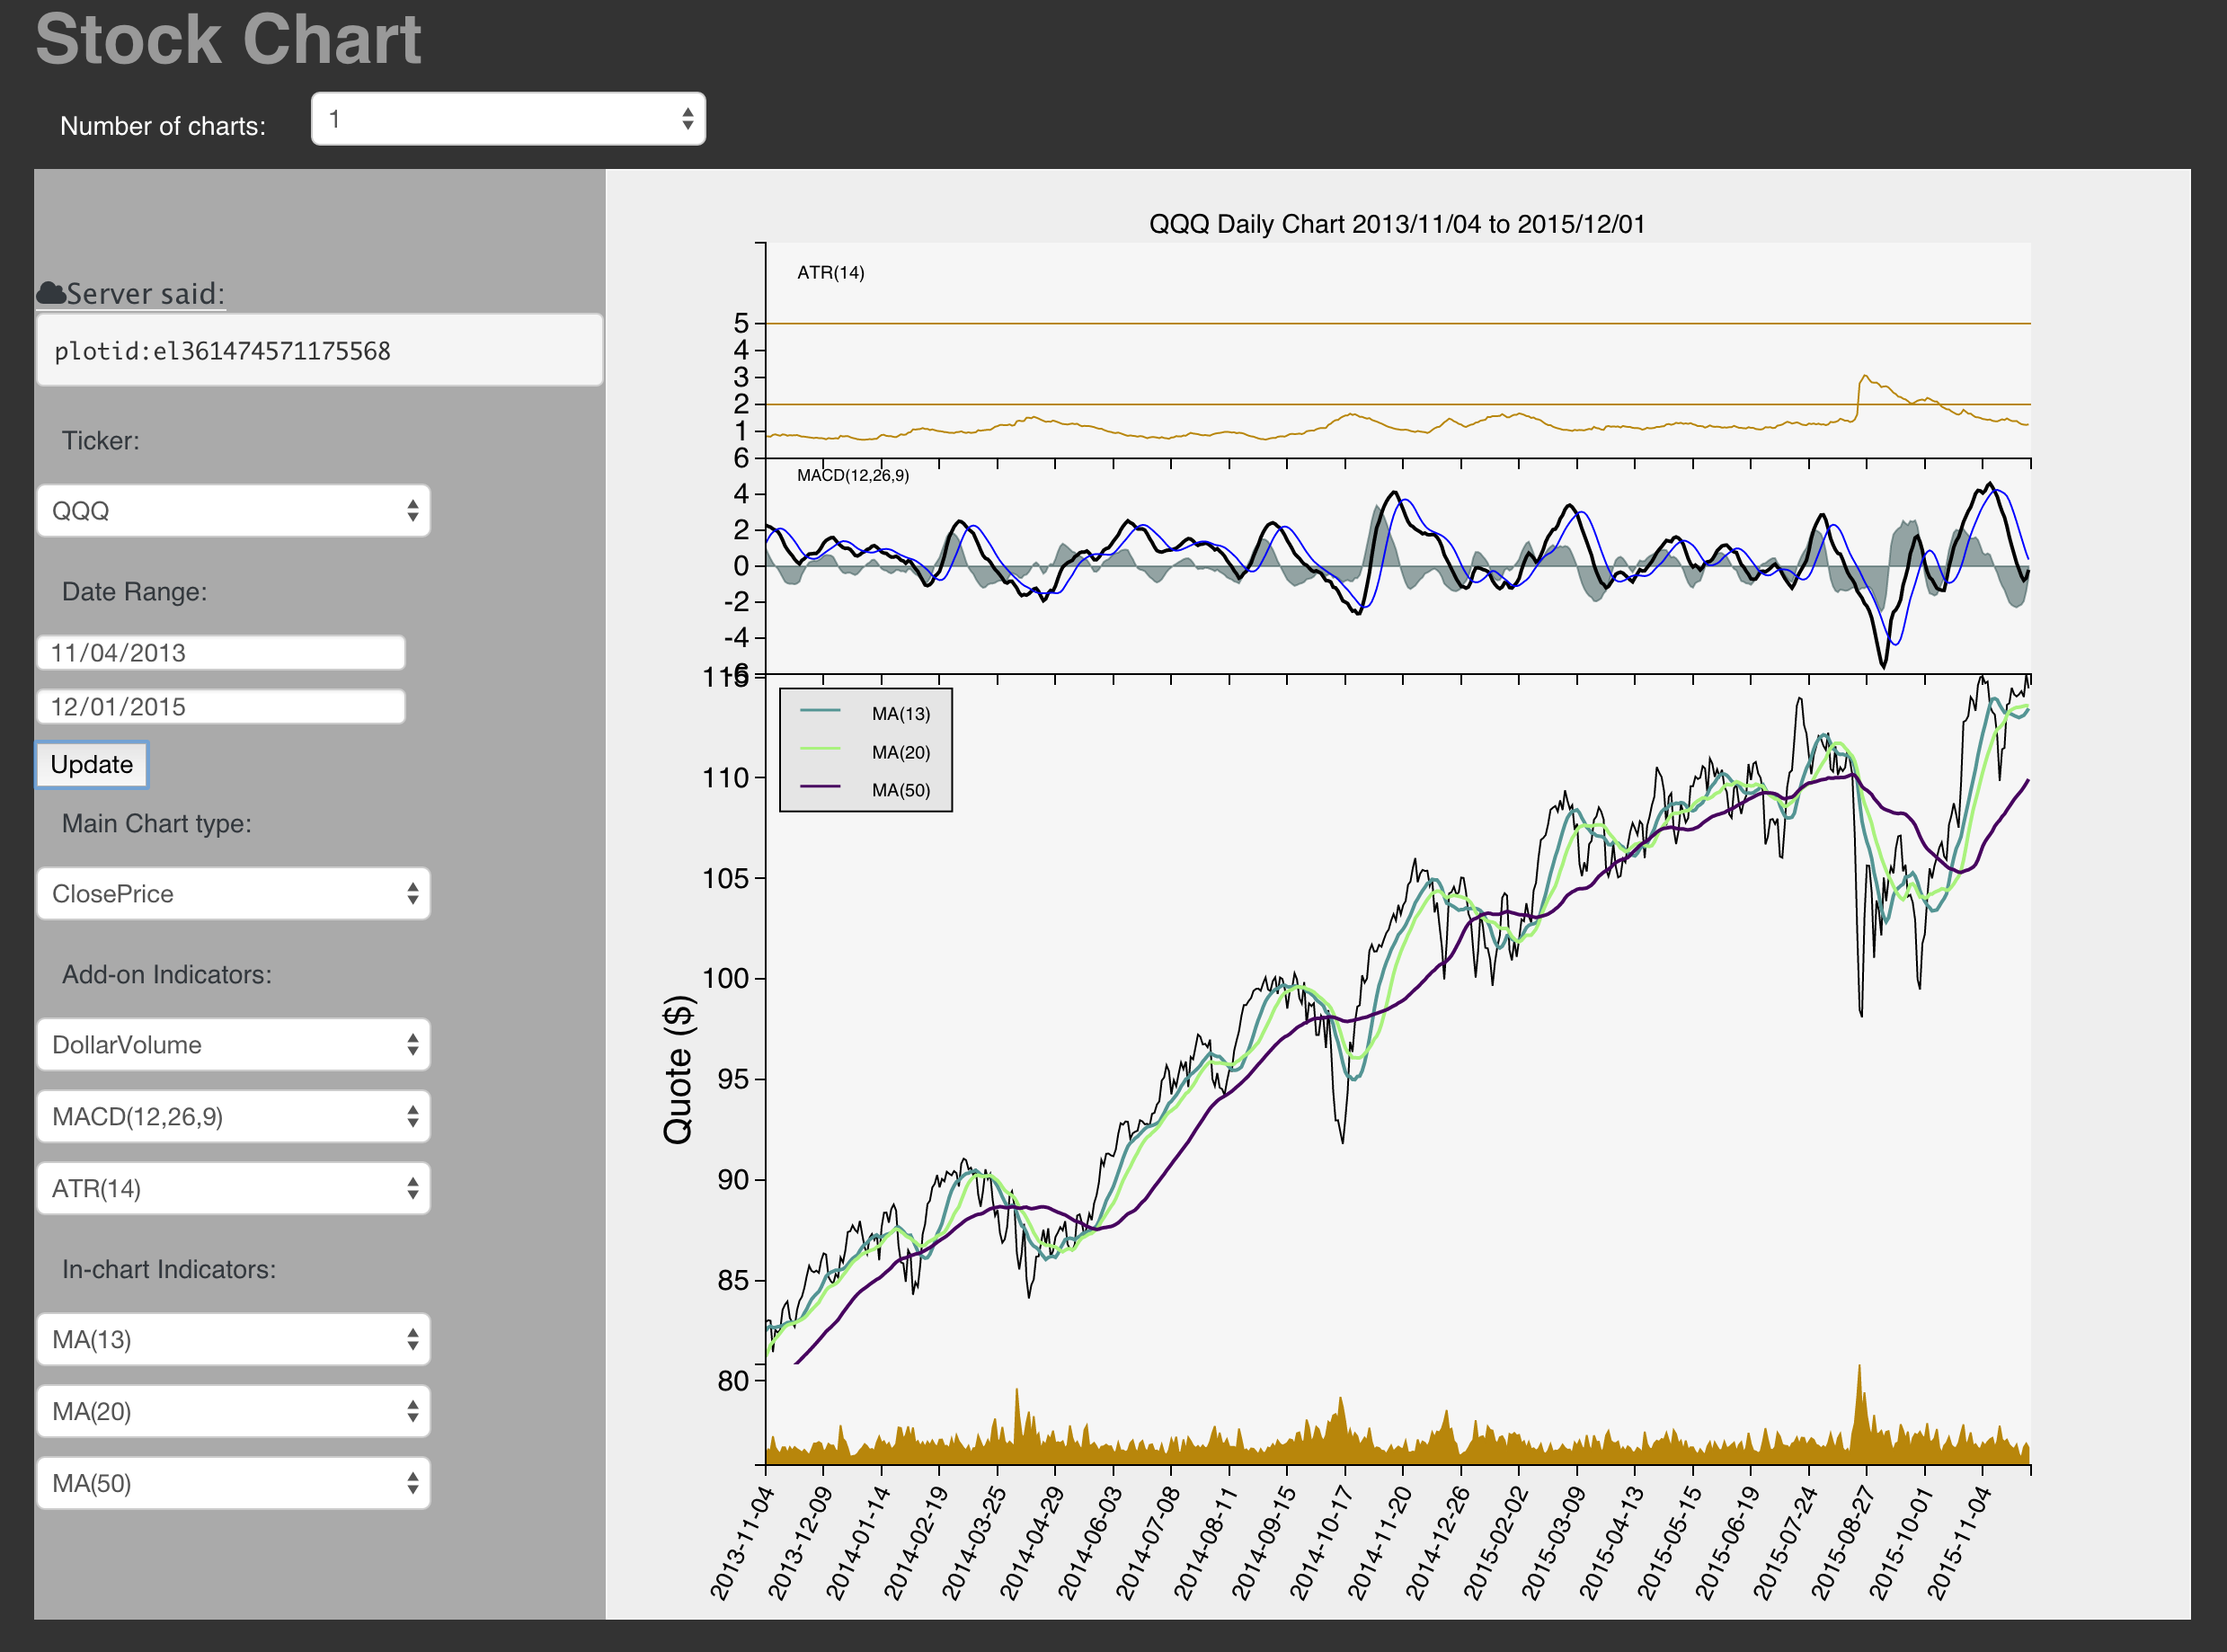
My python webapps uses Tornado webserver, websocket data communication, and mpld3 package to convert matplotlib graph to D3.
Disclaimer: requires tornado webserver
If you want to run the webapp yourself, download source from my stockchart and aflvis git repository.
Dependencies:
Python, Tornado, Pandas, Numpy, matplotlib, sqlite3, mpld3
Stock Market index long-term analysis with indicators

Plotting the stock data and its indicators is the first step of a financial viz system, so I made it a demo infoviz project. The project features dynamic data retrieval and storage mechanisms. The data is temporal, the pandas library is used to index and resample data to different time intervals for plotting. Numpy is mostly used for indicator computation in this demo. Numpy and Scipy are widely used in strategy formation and backtest computation.
Computation of technical indicators
Another example: Accumulation Distribution Line
For more example of trading system implementations using python, see here and here
Read More: A Websocket viz application : Stockchart
-


The games of Australian Rules Football (usually referred to as AFL games) are quite different from American football. All of their stats are hosted online at afltables website for convenient data minding.
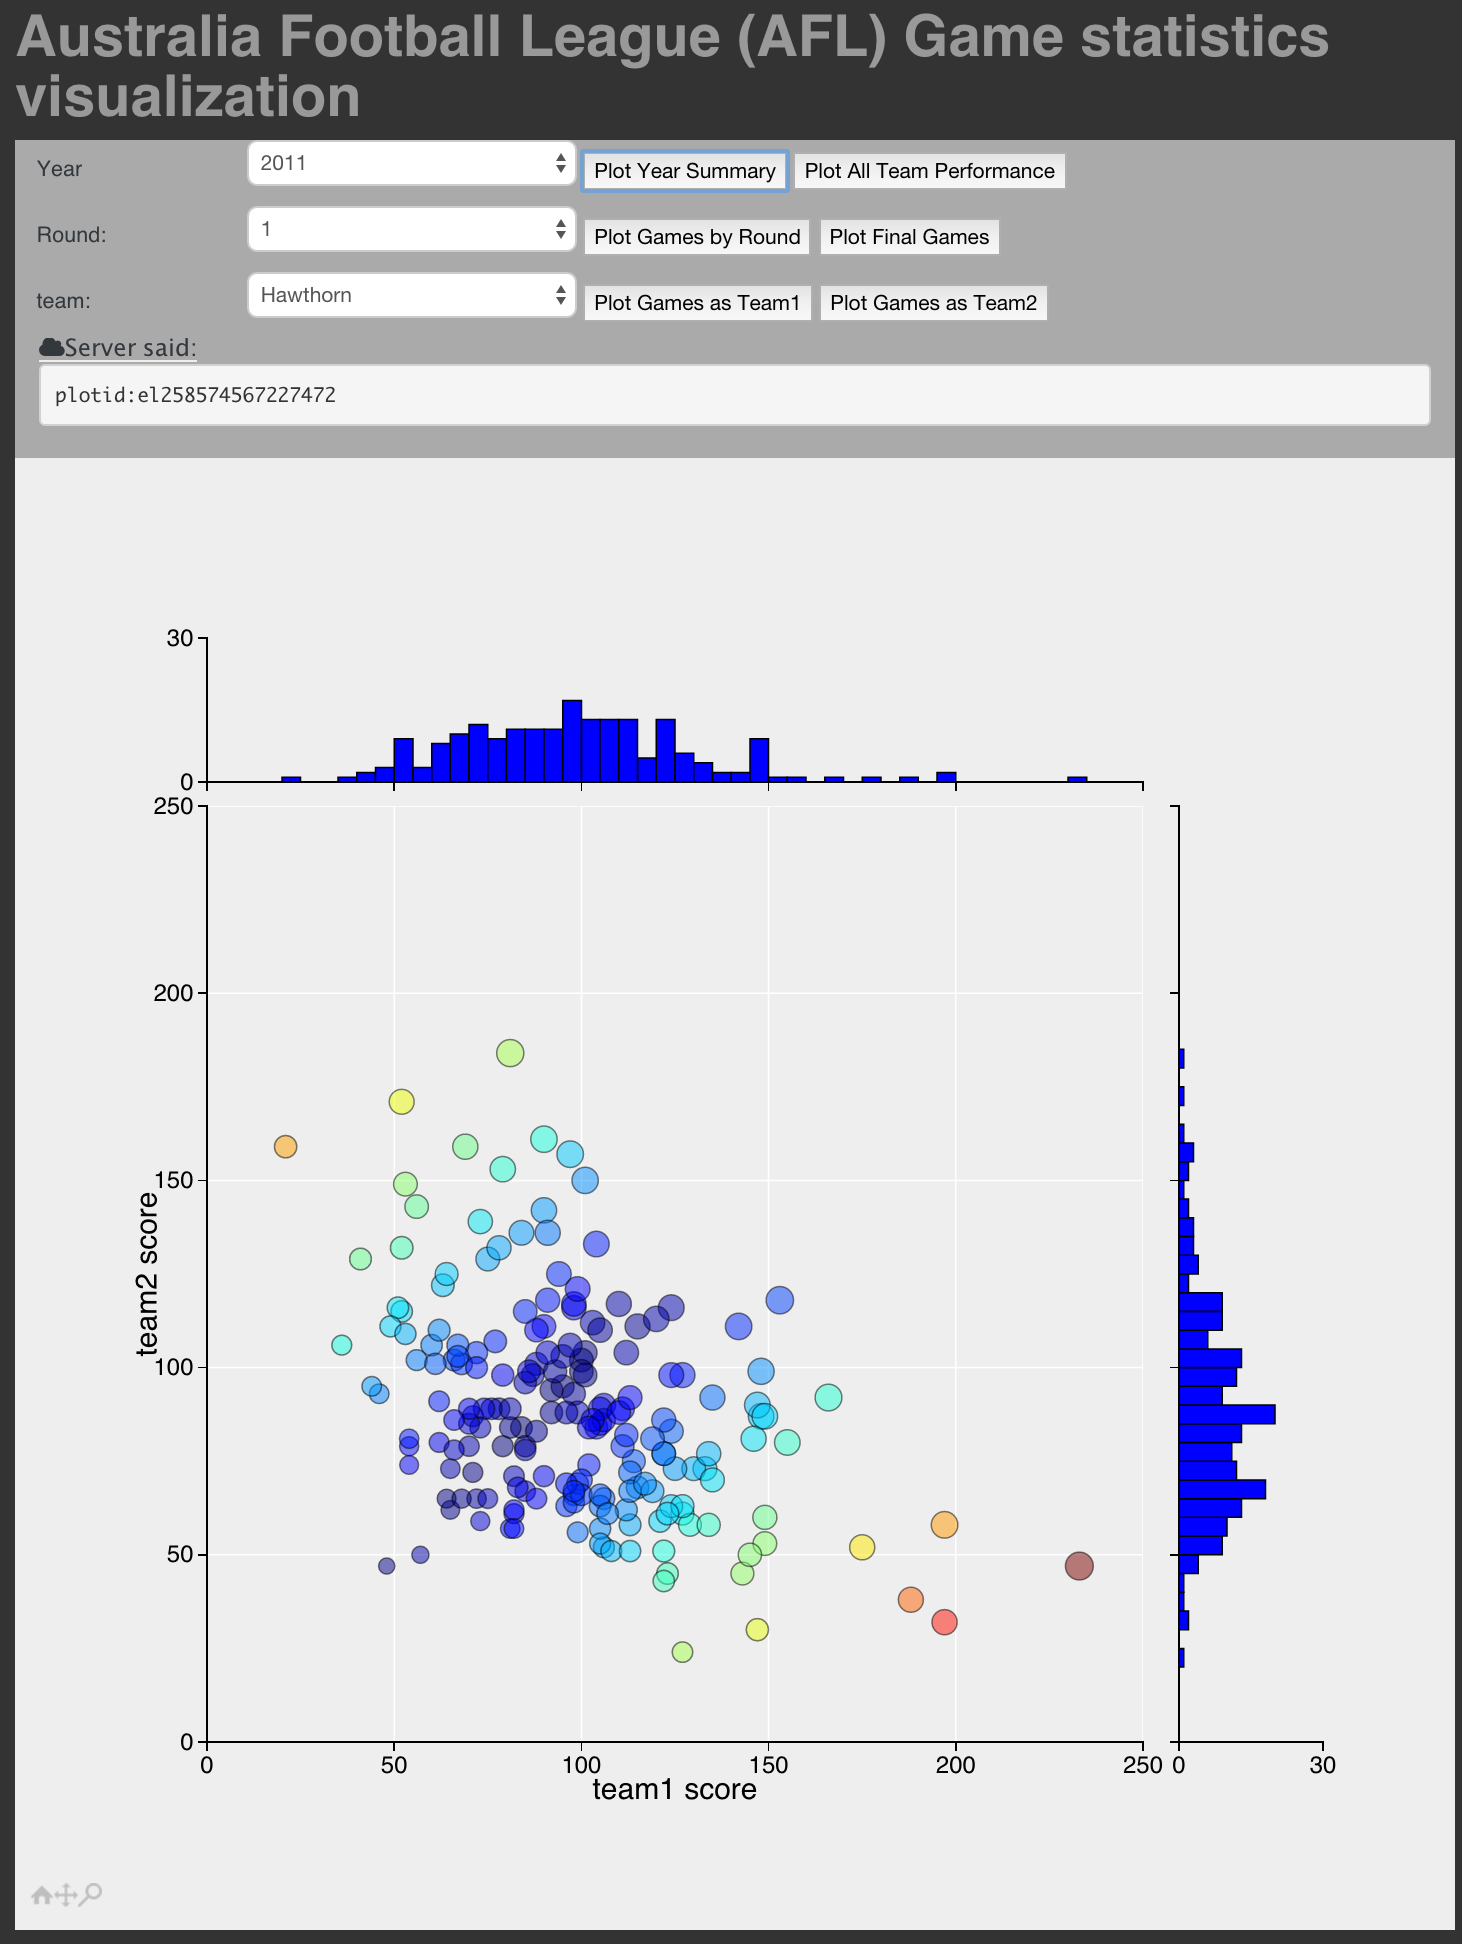
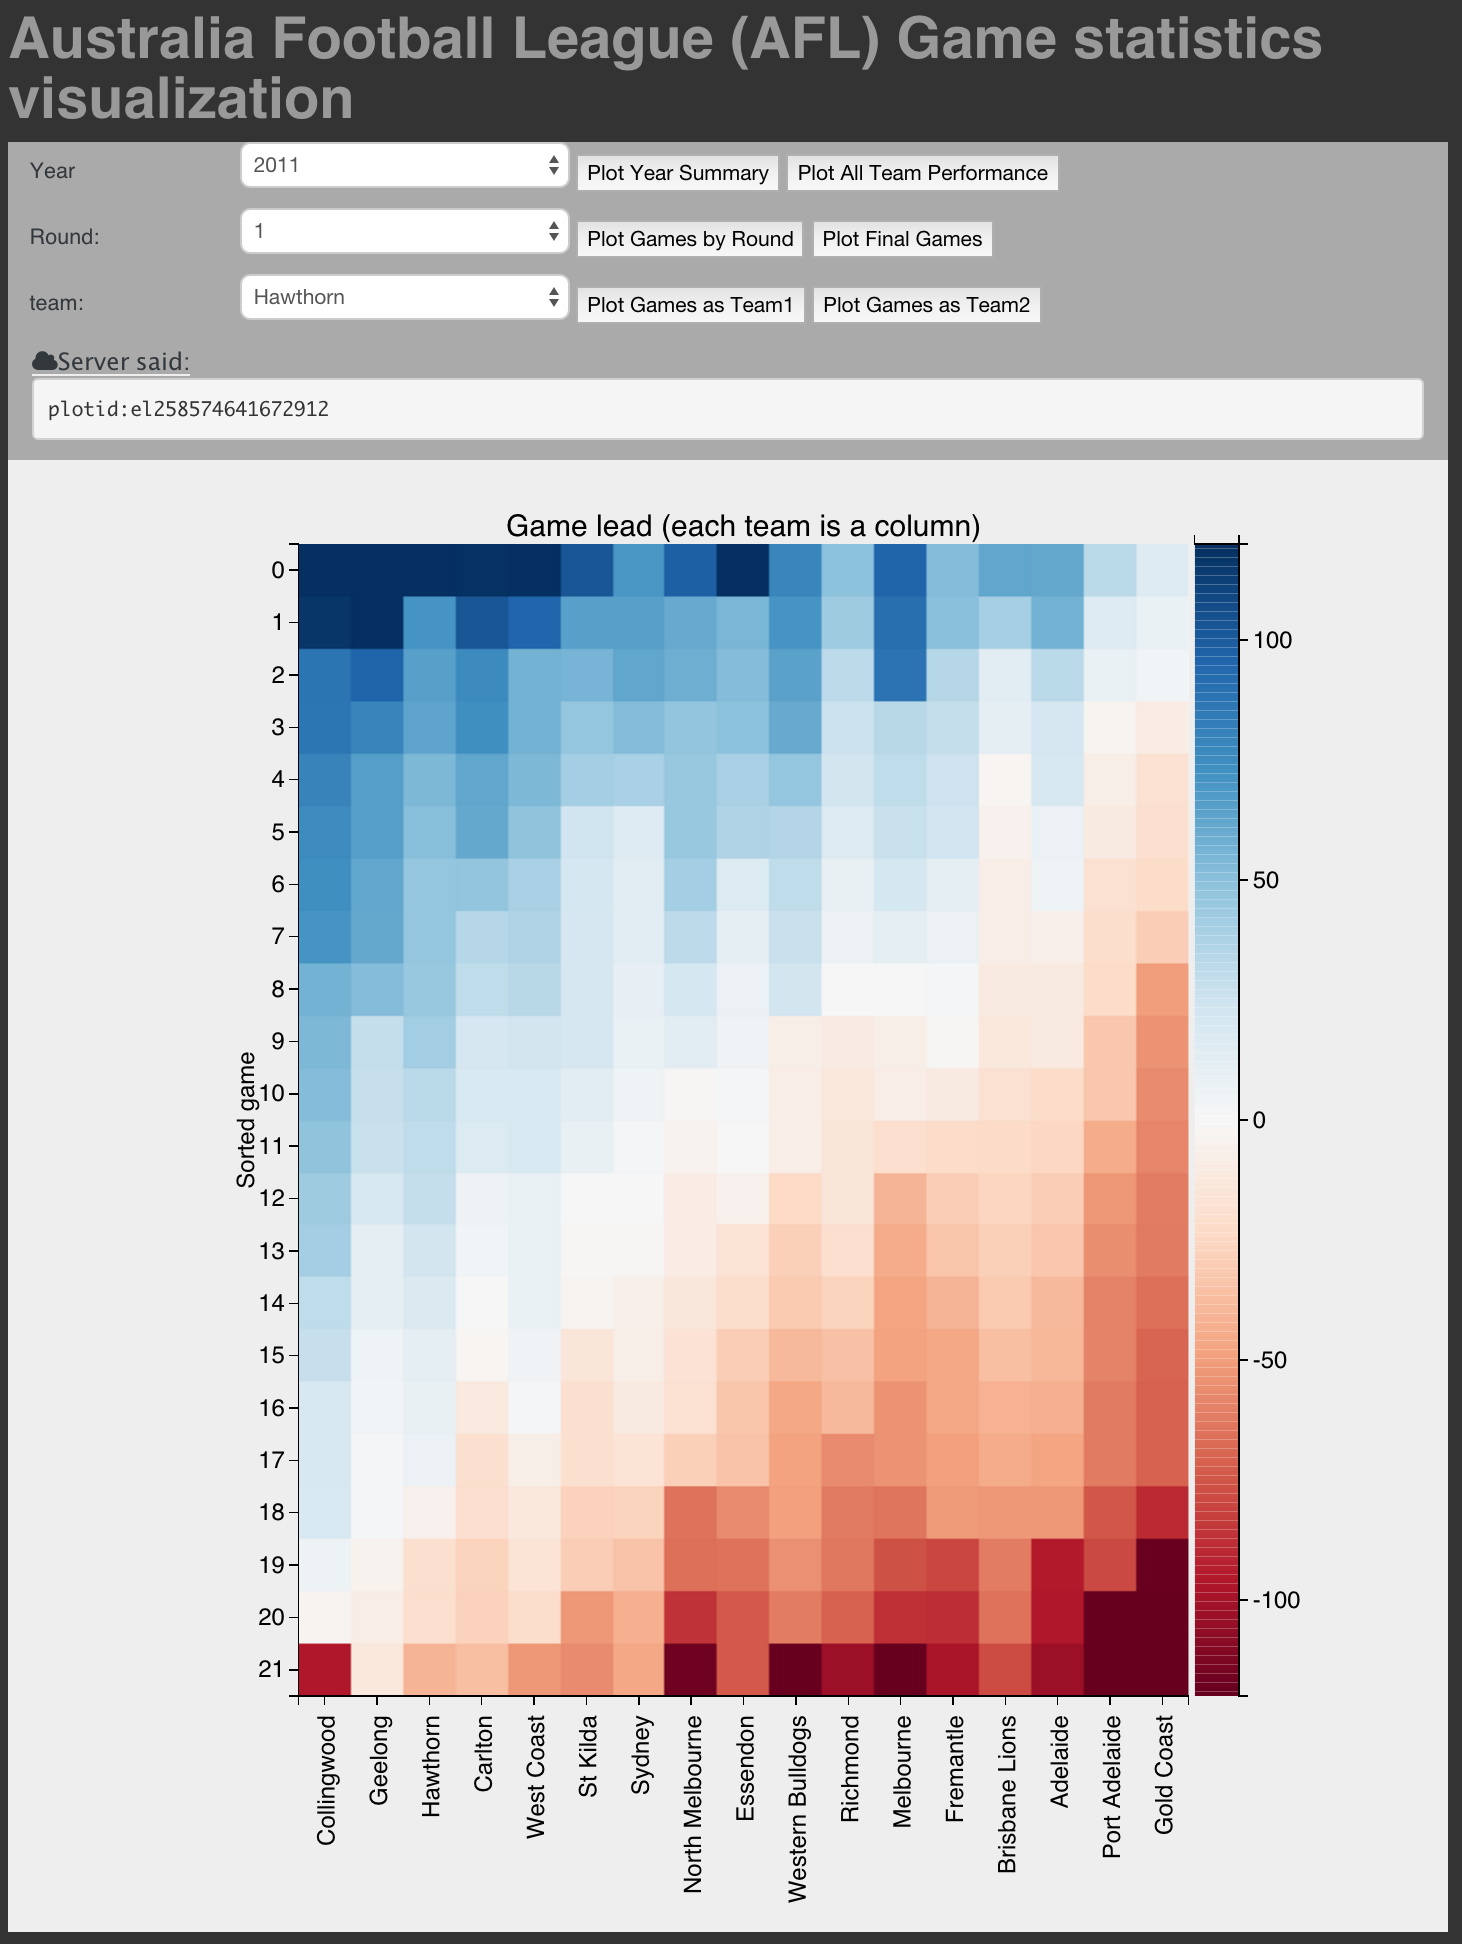
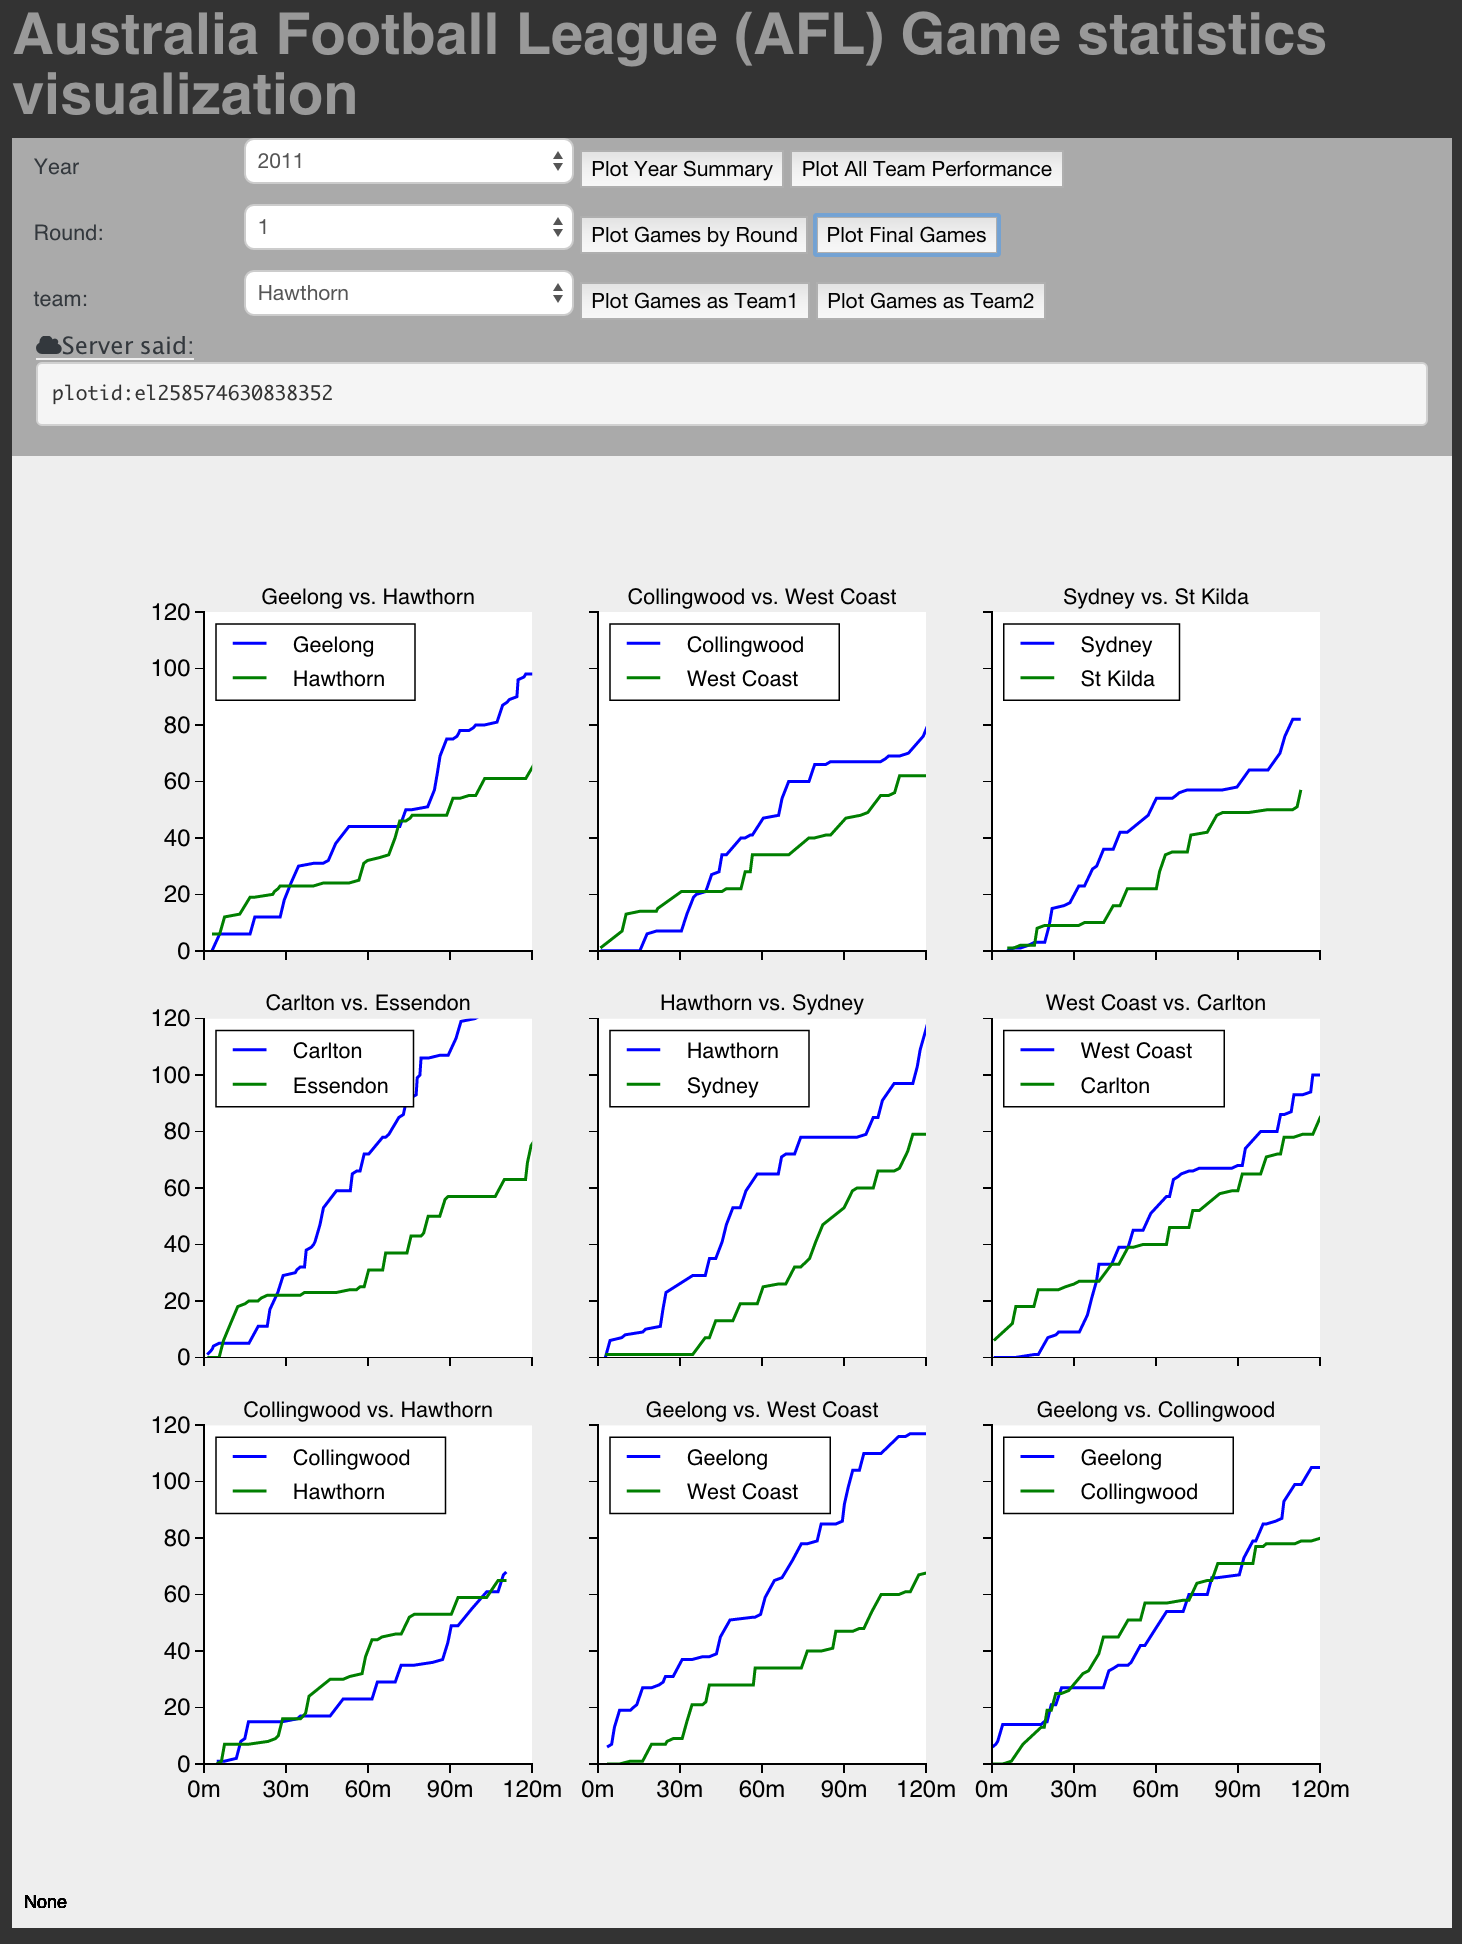
In this project I’ve mined some play stats data from year 2011 to 2014, and created plots to visualize the games. Some conclusions can be drawn from the plots, and further analysis can also be found from papers, e.g. a paper titled “The game story space of professional sports: Australian Rules Football”, by authors: Dilan Patrick Kiley, Vermont Complex Systems Center, etc. link to the paper
A lot of analysis has been applied to the data. For example, the MatterOfStats Website (formerly known as MAFL) is a site mostly concerned with predicting and analysing the results of games.