D3 demos
Visualize genome sequence reading errors
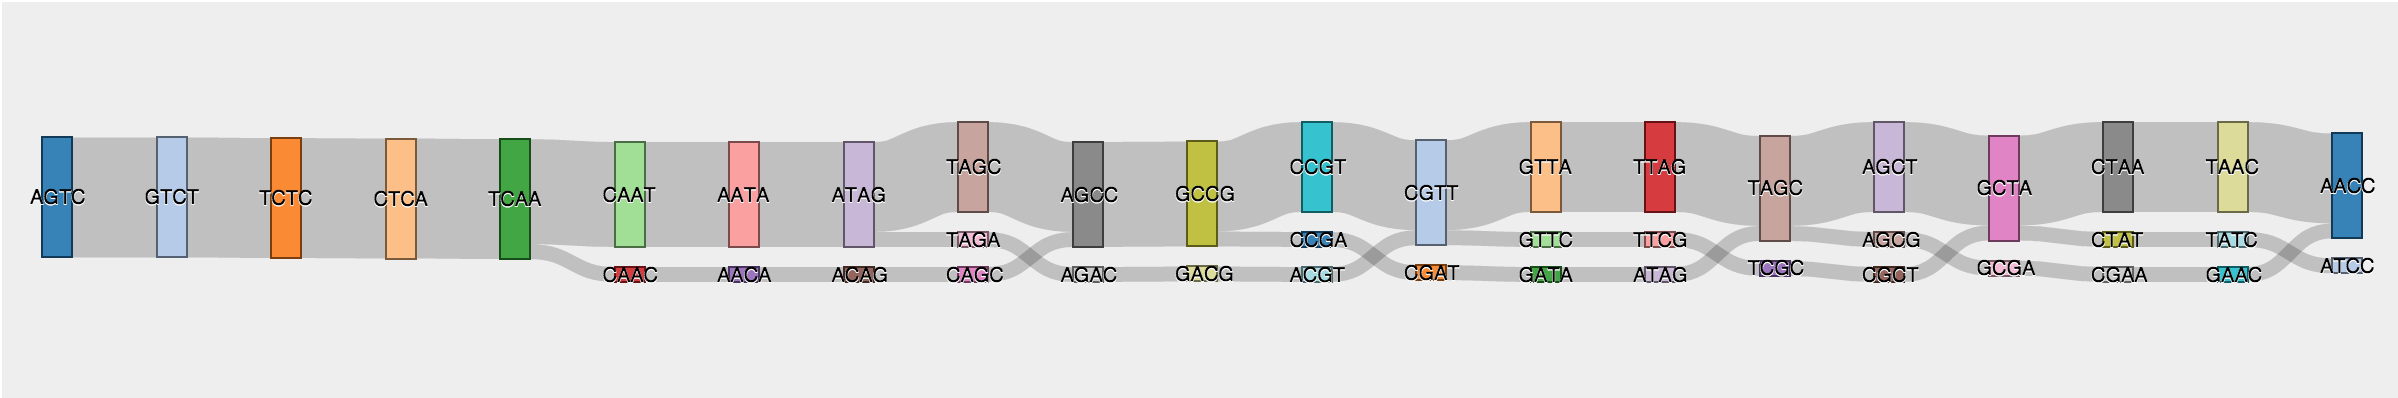
This demo may not be useful in reality but serves as an example of D3 Sankey flow chart
Assume you have 10 readings of a segment of genome, each reading is split into 4-mers (reference: k-mer). This demo plot all readings as a flow, when there is a difference among readings for a specific position, the flow splits out, and then merges back when the readings become homogeneous again.
-
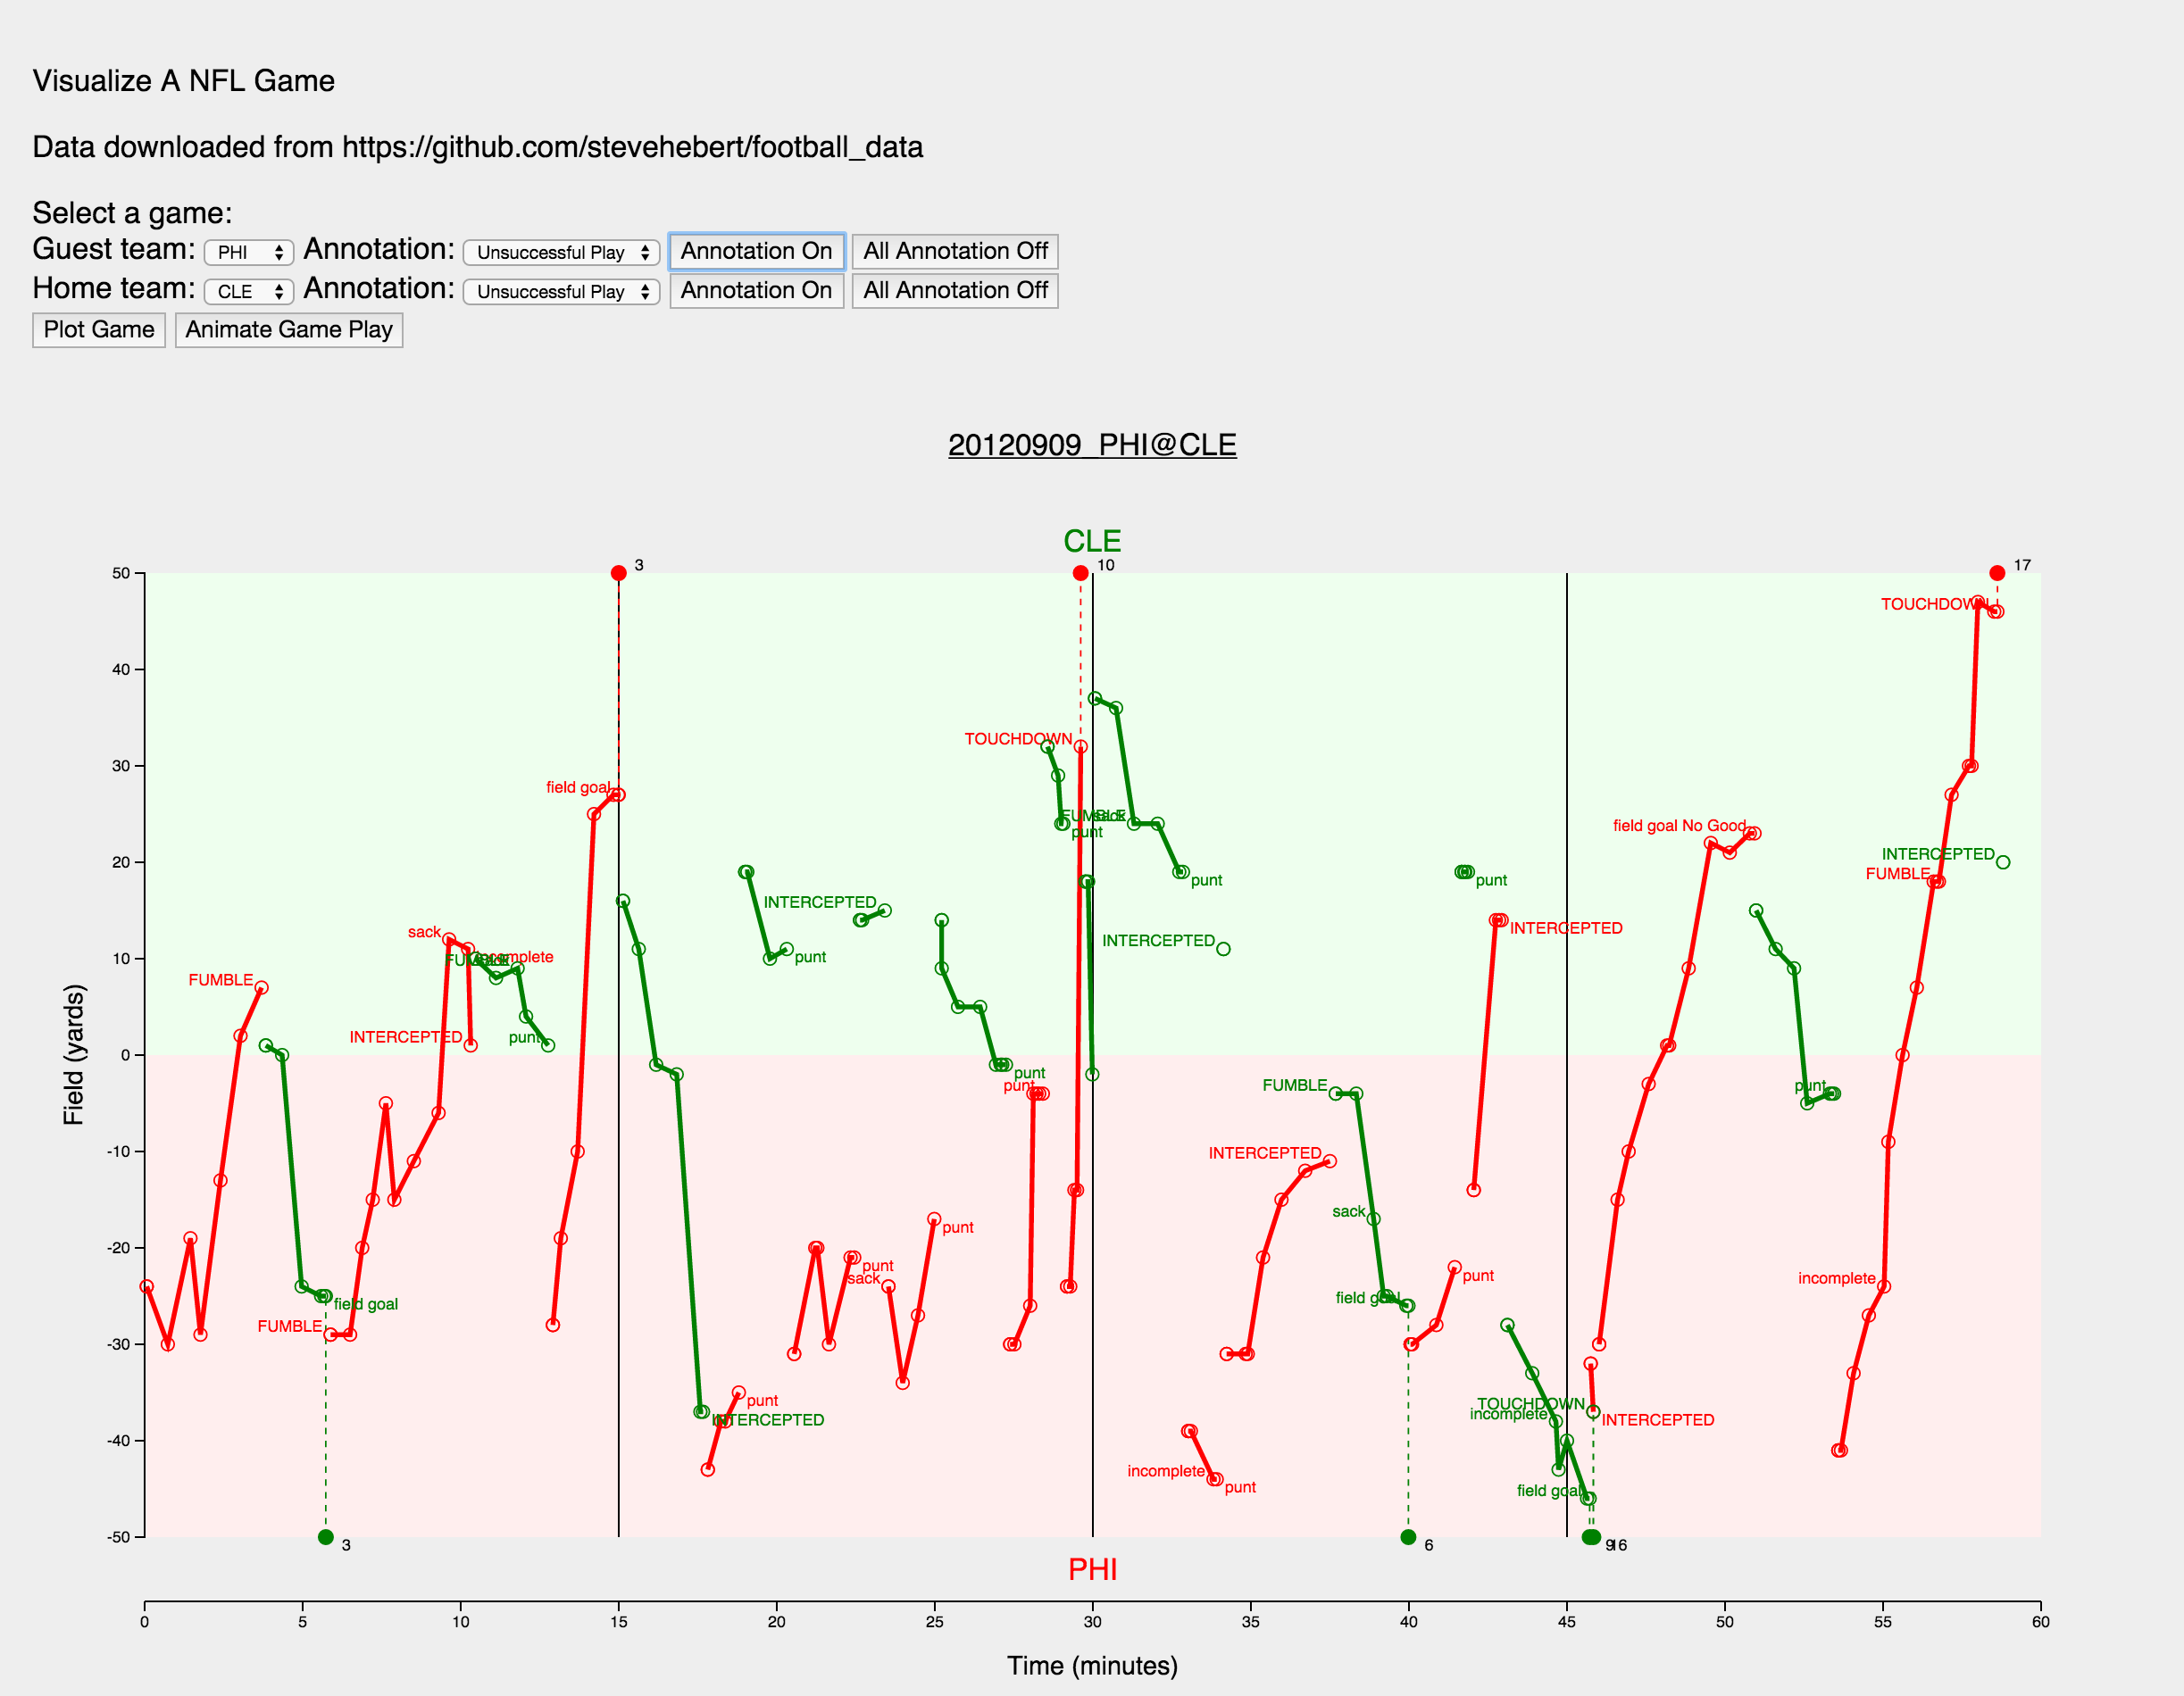
How to plot a NFL game? In this demo I draw the field and mark the yard lines, draw each progression as a line with starting point marked. The two teams are color-coded of course. And then I draw the scoring as dashed line to the end zone, with points marked. Finally, several groups of annotation can be added to the plays, such as unsuccessful plays, and penalties.
Don’t stop here! The game can be animated, drawing each progression separately as time pass forward, implemented using D3.transition
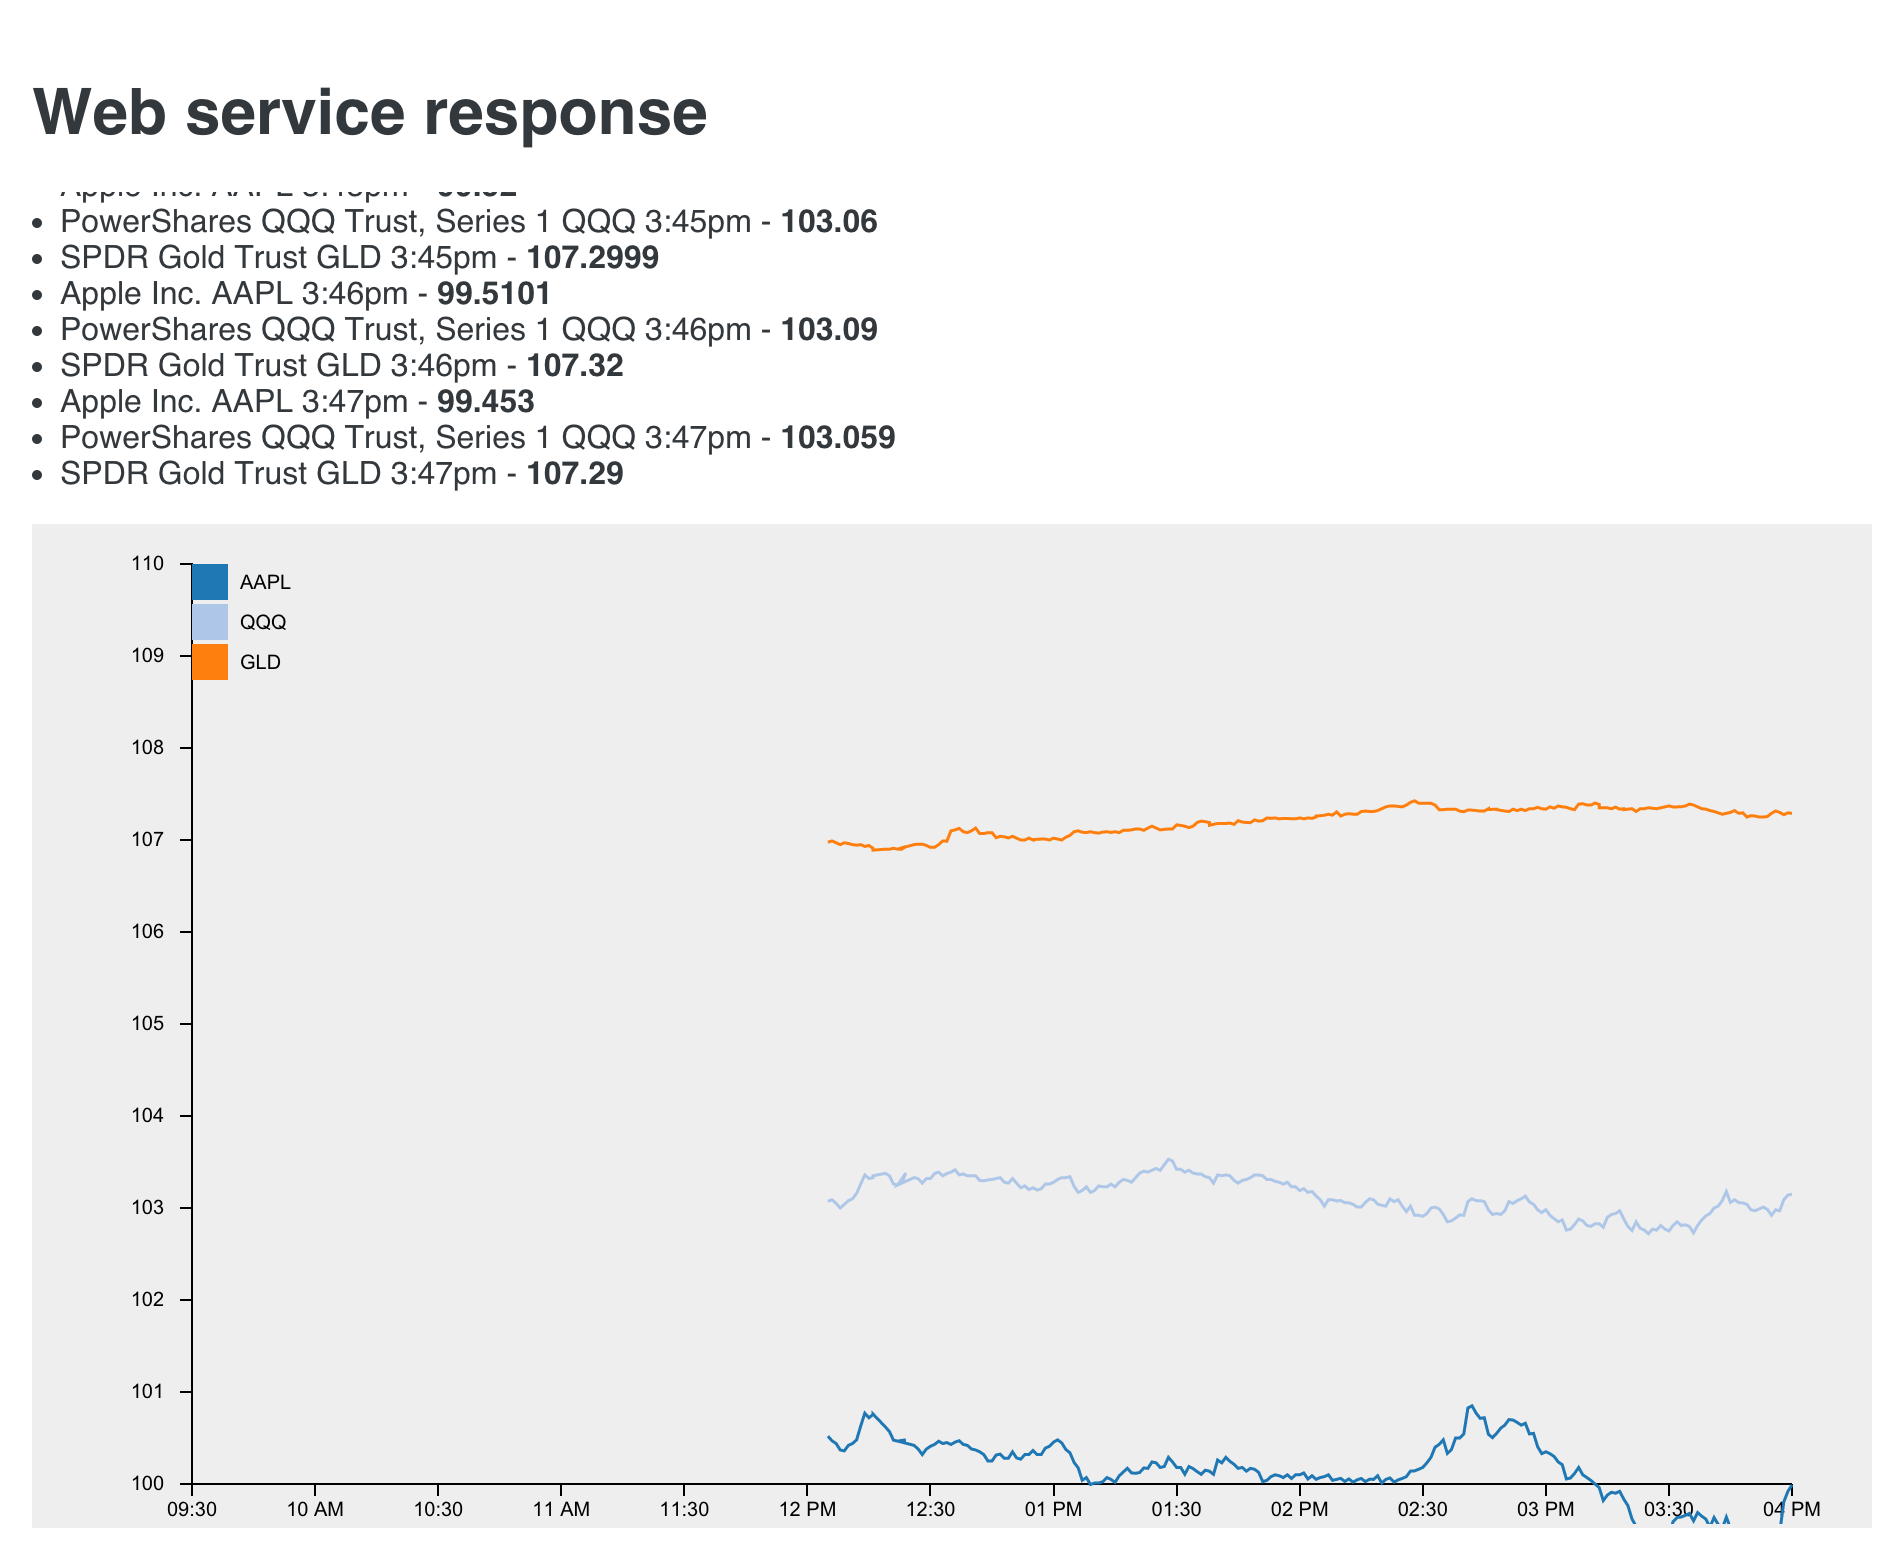
Javascript ajax technology is used to connect to yahoo finance webservice to get realtime quote (15 minutes delay) every minute, and chart is updated automatically. This demo can be applied to similar real time data graphing projects, such as instrument reading.
web service used:
http://query.yahooapis.com/v1/public/yql?q=select * from yahoo.finance.quotes where symbol in ('AAPL')&env=store://datatables.org/alltableswithkeys
As shown in this demo, multiple symbols can be queried at the same time and plotted in the same chart, but there will be a problem that the y axis scale can be very different among the symbols. So maybe plotting in multiple subchart with different y scale might make more sense. See an example in the next chart: US Lower 48 states crude oil production.
US Lower 48 states Crude Oil Proved Reserves, Reserves Changes, and Production
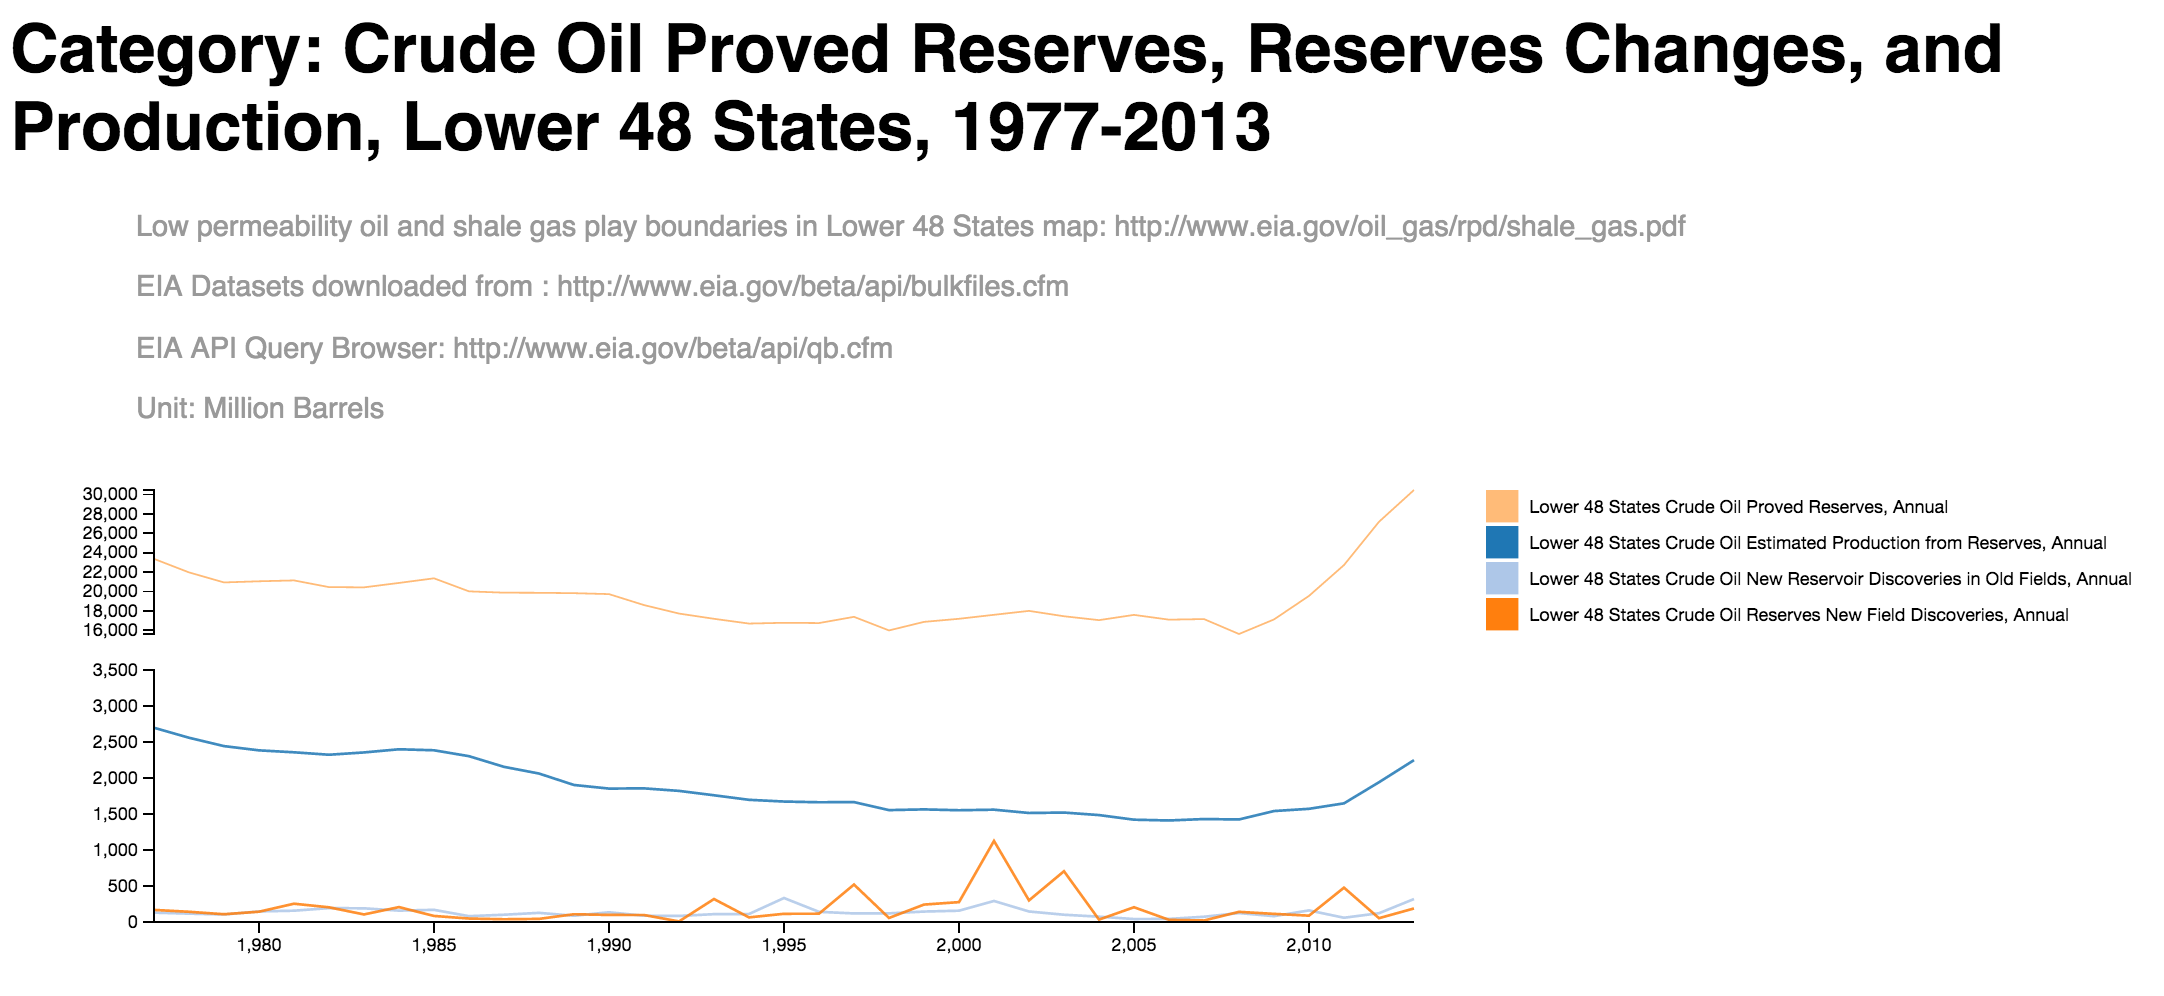
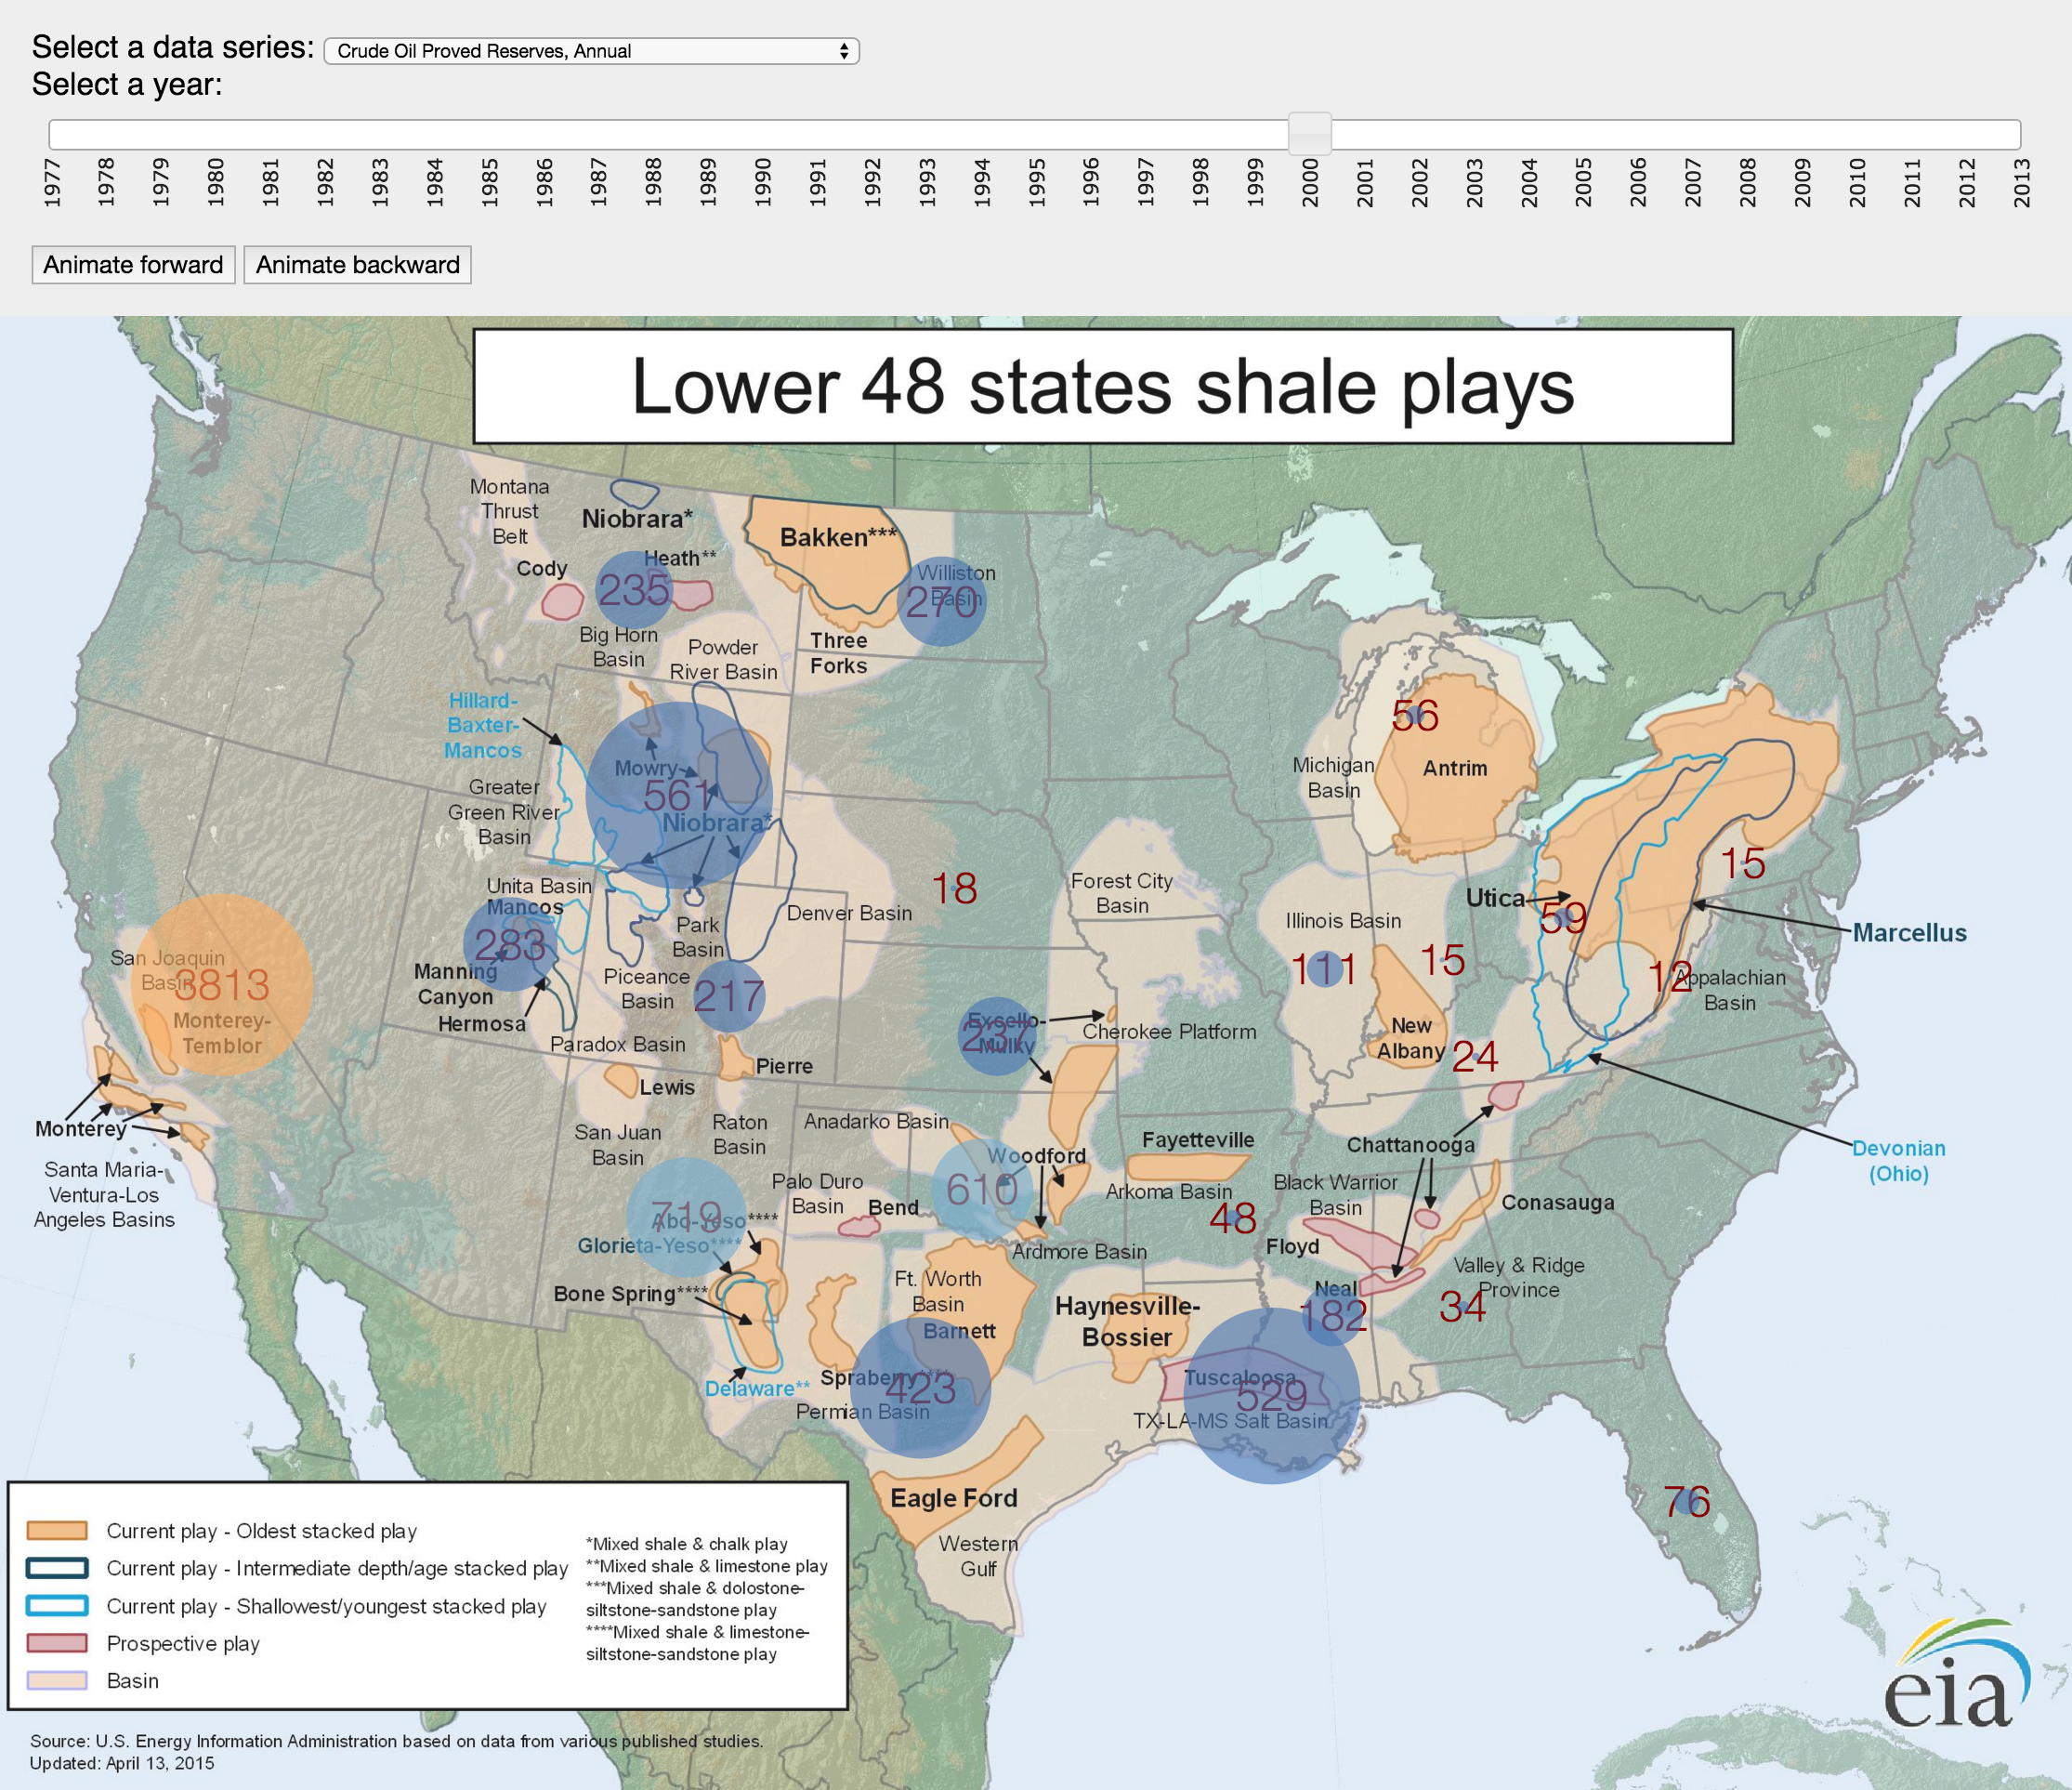
The shale oil fracture technology has rapidly changed the dynamics of U.S. crude oil production, import/export, and WTI spot price in the late years. More crude oil reserves are found at basins such as Bakken and Permian.
This demo plot the US lower 48 states crude oil proved reserves and productions over the years 1977 to 2013, as line graph, and on a US lower 48 states map. Animate them through the years to see the change.
To draw maps using D3, see Bostock’s tutorial Let’s make a map
Data are collected from EIA open data api and bulk data download
The EIA open data website also provide a open source javascript chart library and chart embedding mechanism
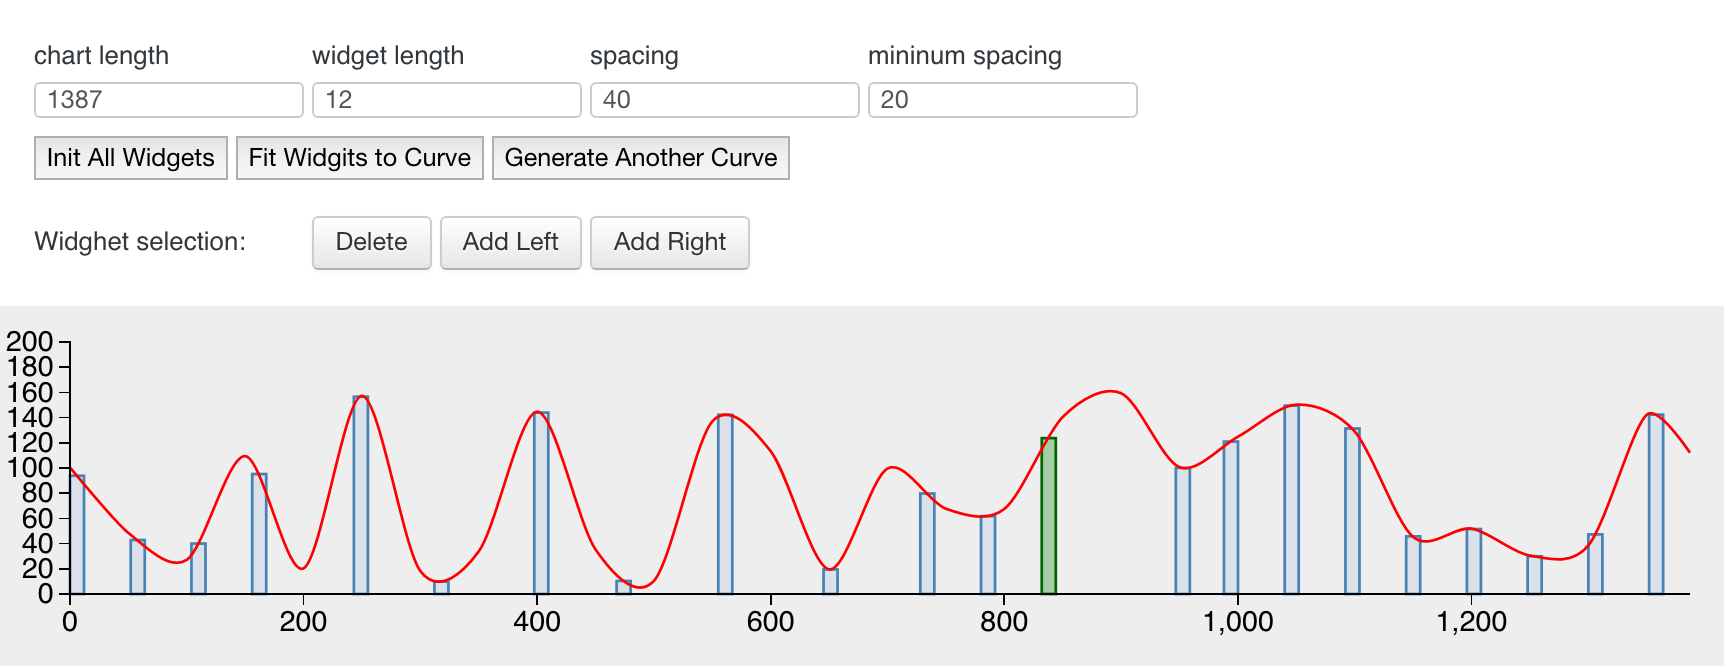
Position widgets to mark a curve fluctuation
This demo focus on user interaction rather than plotting. And the javascript programming pattern : module.
Giving a randomly generated curve, uses are provided marker widgets to mark any specific positions according to the curve fluctuation.
The widgets are really just little rectangles draw on the webpage, but they can be picked, dragged, added and removed, and fitted to the curve’s height. All of the widget information, such as poisition, height, selection status, etc. can be collected and save into json data object.
-

Adopted from this D3 demo, spinning gears with teeth grinding on each other perfectly – this demo shows off CCT’s multi-discriplinary organization, and emphasize on interaction and collaboration. :)
Art work by Brittany Ball.