Interactive charts with Bokeh
Natual Gas spot price (Henry Hub) and UNG tick price
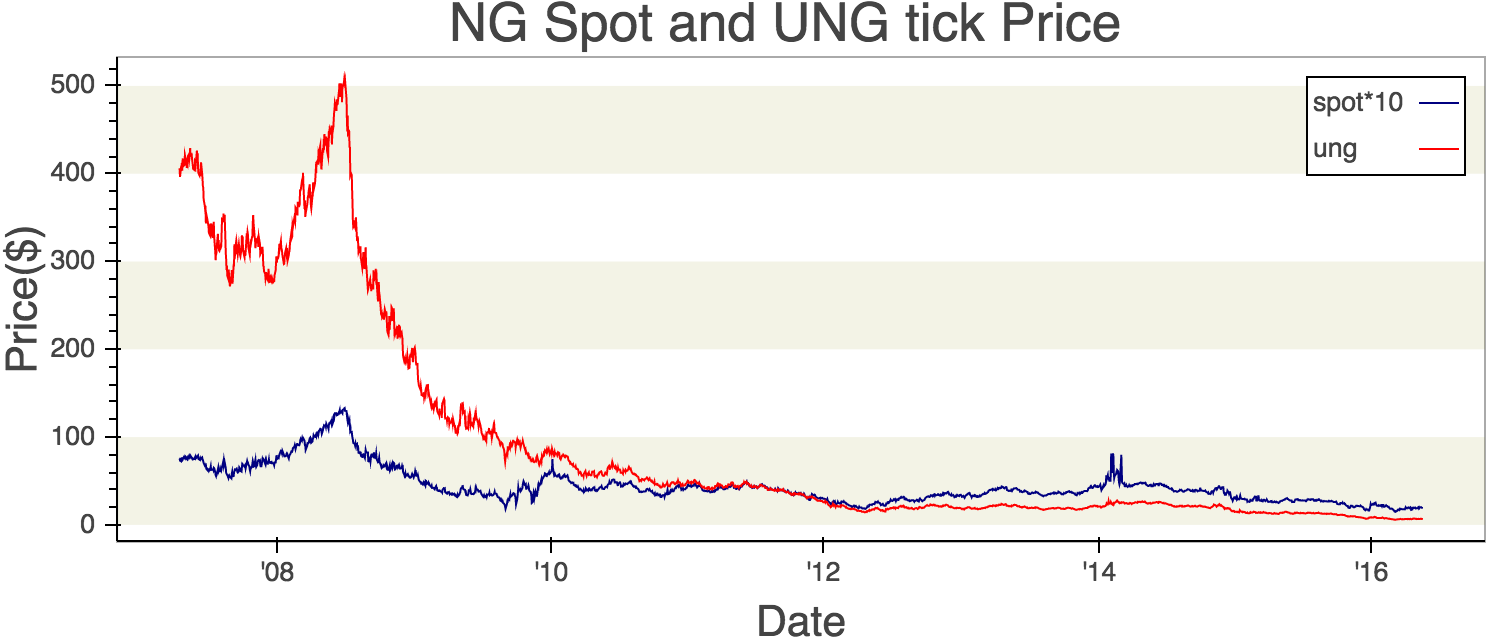
This chart shows US Natual Gas spot price (Henry Hub) and its trading stock tick price (UNG). The date ranges from Apr 2007 to May 2016. A crosshair is shown automatically when mouse hover over the chart, and information box will appear when mouse is on a plotting line. Use tools such as boxselect to interact with the chart.
Source code: ngviz
Future plan: the chart will automatically update to current date when re-visited at a different date, since new daily data should come in. Two options under investigation:
- Daily timeout callback update of datasource (https://github.com/bokeh/bokeh/blob/master/examples/app/timeout.py), suppose new daily update file is available at the server (e.g. new-[date].csv). This means in the backend new daily update data is retrieved automatically and added to server.
- Use Bokeh AjaxDataSource (http://bokeh.pydata.org/en/0.11.1/docs/reference/models/sources.html) – not well documented and can’t find an existing working example. And if this depends on Bokeh server then we need extra setup for Bokeh server proxying our current CCT web server, which may not be feasible.
Here is an example chart which updates every week: Weekly Natural Gas Storage release: estimate and actual:
https://www.estimize.com/economic_indicators/weekly-natural-gas-storage