Advanced Visualization Services

Center for Computation & Technology


Software Training:
Avizo, VisIt, Paraview, VisTrials, Maya, Tableau

We offer software training and tutorials from our web training section. Most of our software training materials comes from collaboration projects.

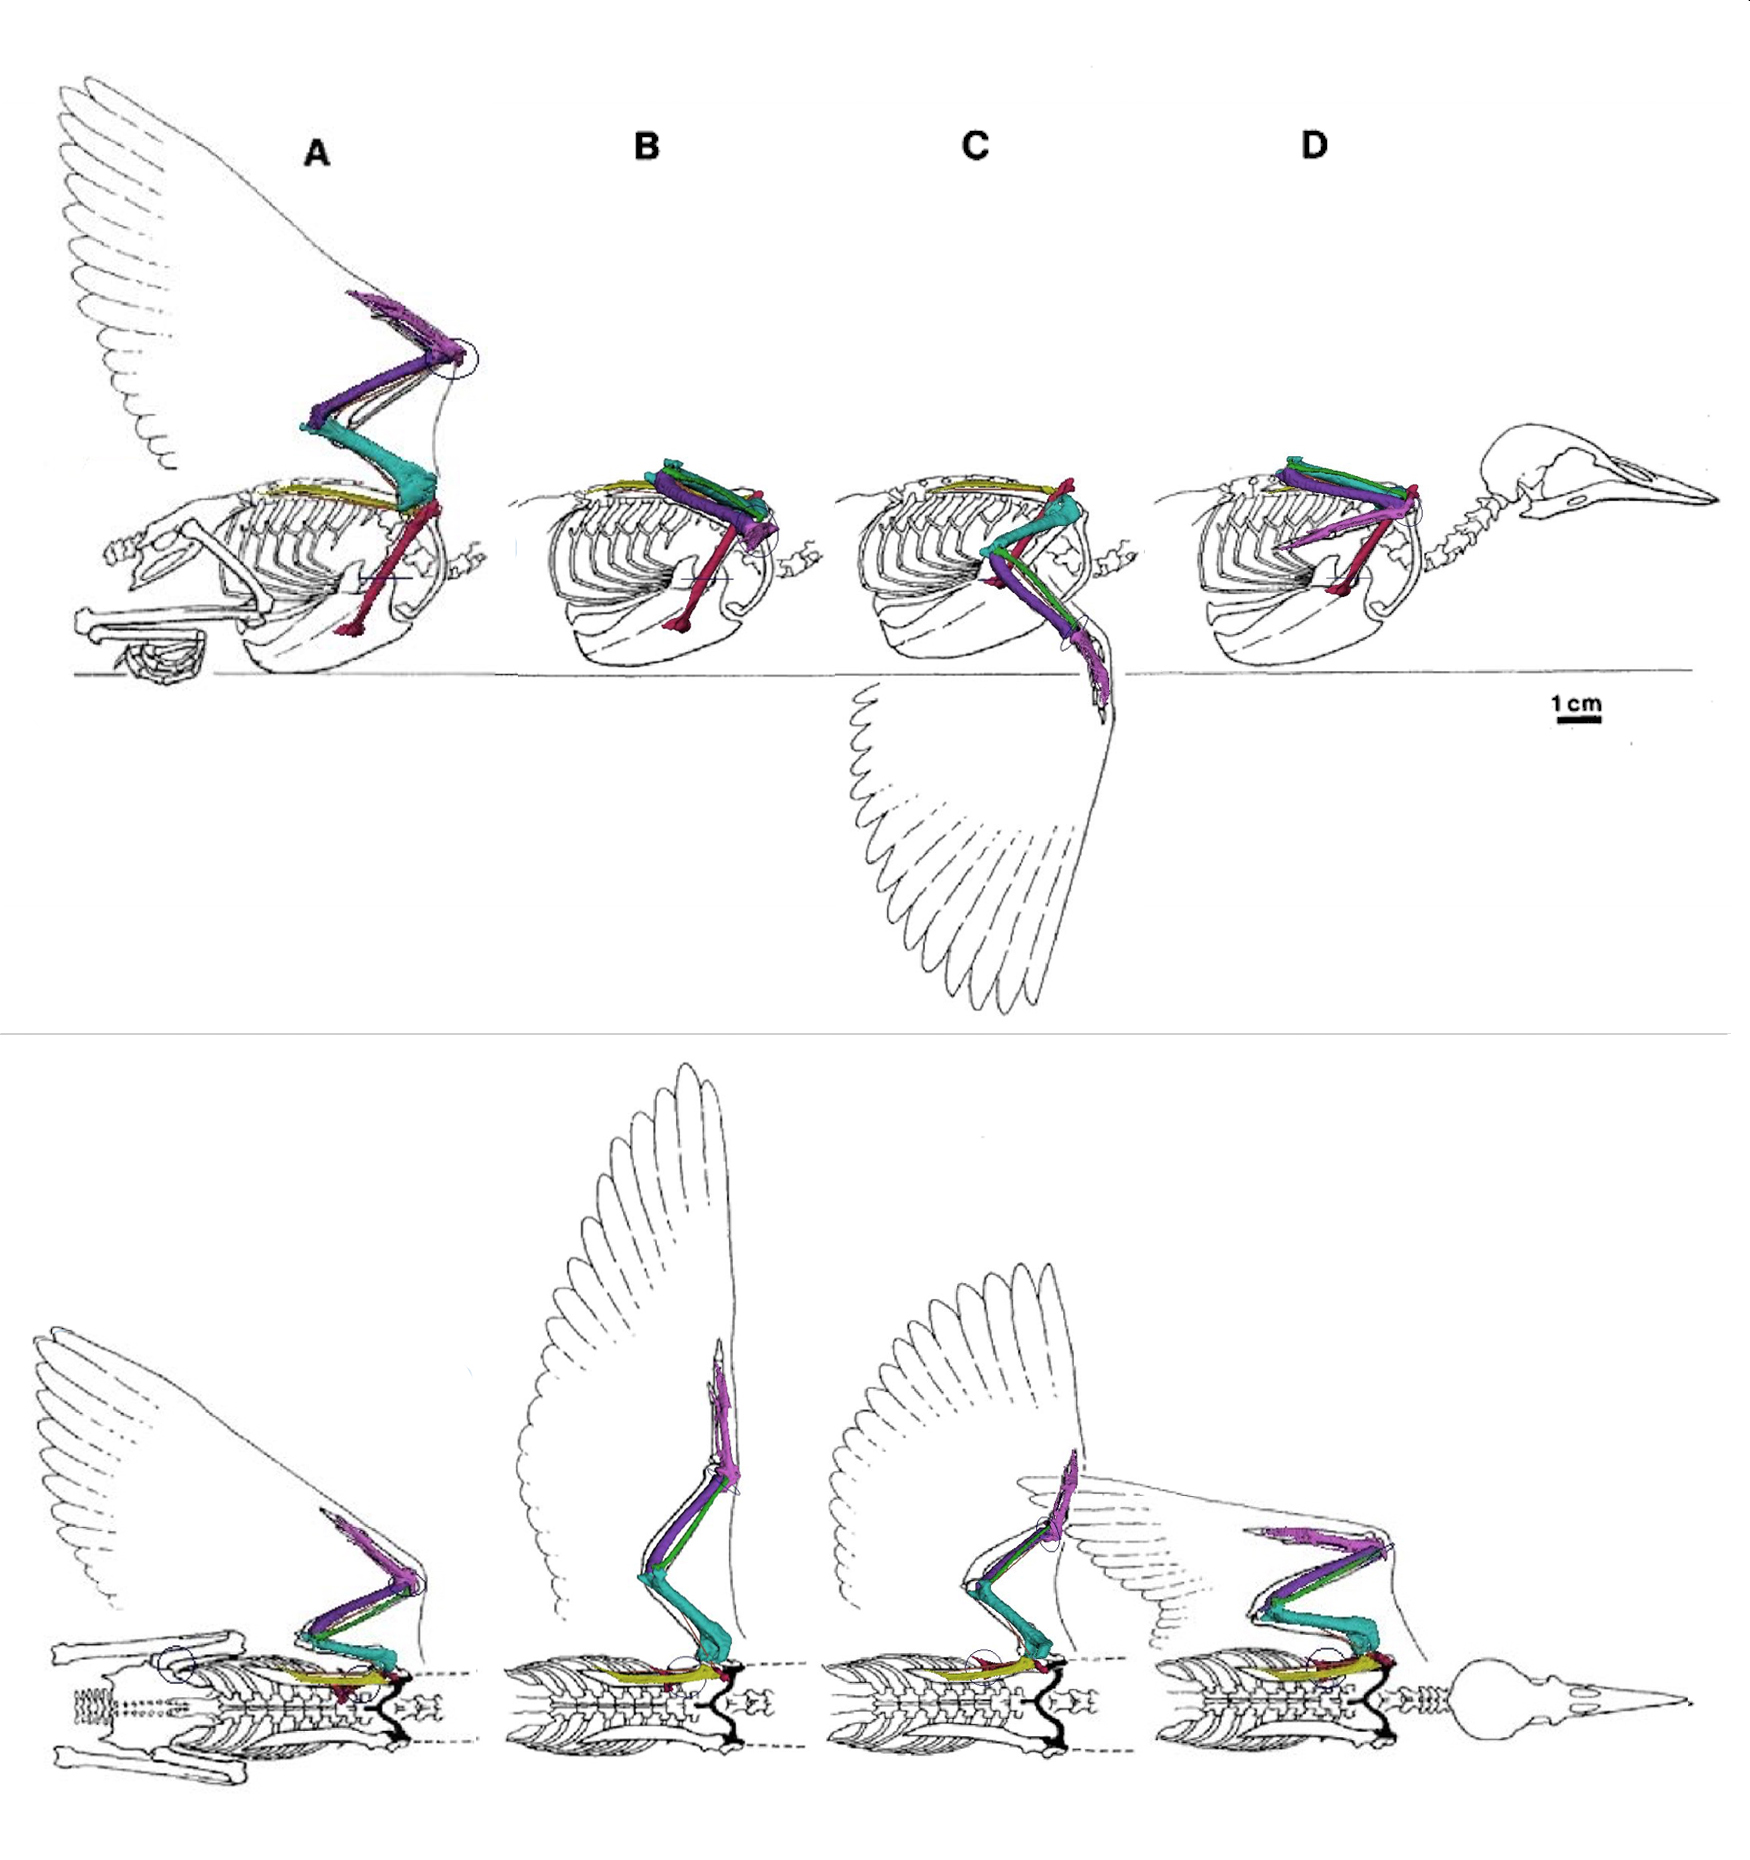
The image at right shows an example tutorial about Avian wing pose match to four phases of the wingbeat cycle. This project starts with 3D CT scan of a House Sparrow Passer domesticus, uses Avizo® visualization software for wing bone segmentation, and Maya® software for pose-matching and key-frame animation. This tutorial comes from a student project by Christina Daigle.


Collaboration:
Visualization projects

We collaborate with LSU faculty and researchers on visualization projects. These projects spread among multiple disciplines such as Physics, Chemisty, Biologoy, Civil Engineering, Mathematicas, and more. See our project documentation page for more details.

The image on left shows the complex fracture patterns that form during the drying process or when brittle materials are exposed to sudden, extreme temperature changes. Research by Dr. Blaise Bourdin, Dept. of Mathematics


Teaching:
LSU Honors Class HNRS 3035

Every spring semester since 2011 we co-teach the LSU Honors Class "3D Imaging and Animation" (HNRS 3035). During teaching we use visualization software VisIt, Avizo, Maya etc. to solve real scientific problems. This class is usually organized by Distinguished LSU faculty Dr. Leslie G. Butler and Dr. Dominique G. Homberger. See our class album webapp for more student project images!


Scientific Showcase:
Images, Movies

We make high-resolution images and movies to showcase LSU's research and scientific discovery.

The video on the left shows an artificial fracture of shale rock containing a single layer of proppants. The proppant segmentation is useful for examining detailed geomechanical/structural changes in the proppant packing under various loadings and subsequent changes in the fluid flow. Research by Dr. Clinton S. Willson, LSU Department of Civil & Environmental Engineering, Dr. Karsten Thompson, LSU Craft & Hawkins Department of Petroleum Engineering. Image processing by Paula C Sanematsu.


Research and Development:
Data Visualization Web Applications

We develop visualization web applications using Javascript libraries and APIs, and Python packages. Websocket technology is used for server-client communication. See development tutorials for implementation details.

Javascript components: D3.js, mapbox API, googlemaps API, tableau API.
Python tools: numpy, matploglib, mpld3, pandas, bokeh, celery.
Web framework: MEAN stack (javascript), Django (python)
Database: MySQL, SQLite, MongoDB

CONTACT

Contact us at:

Center for Computation & Technology, Digital Media Center, Louisiana State University, Baton Rouge, Louisiana